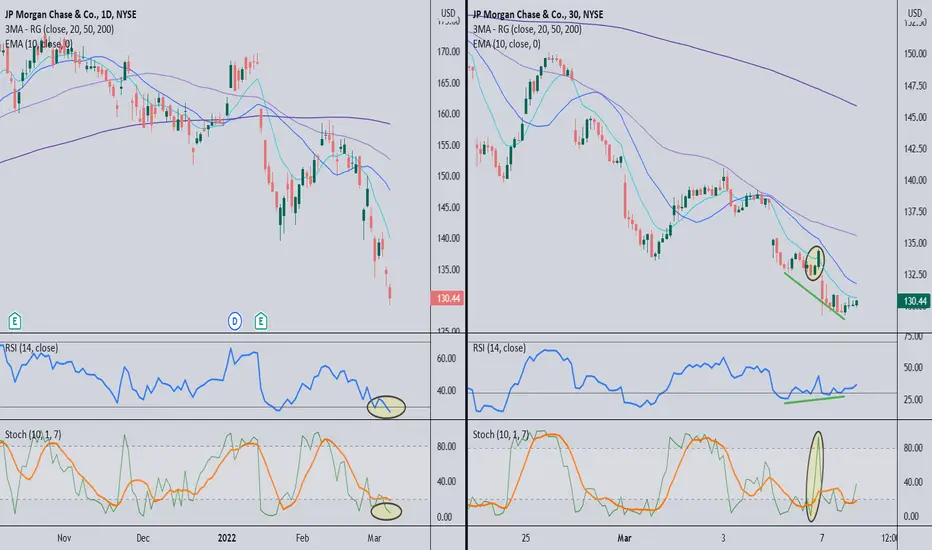
On the daily chart price is oversold and needs to revert back up towards moving averages. 30min chart shows ovals around the candles that generated a stochastic bull signal. Those three candles showed buying strength, and after a another move lower (which usually happens) I am looking for price to hold 130 and move higher. Green lines show bullish divergence between RSI and price. Risk is low as price is near the lows and 130 can also be used as a stop.
Trade closed manually
On 7 March I bought weekly 131 calls for $2.42I did not exit using stop losses because I Monday afternoon selling would reverse before Friday. I held my calls because I was comfortable with my risked capital amount. I also had high confidence in my 30 min chart.
On 8 March price made a higher high on 30min chart and then retreated, but never broke Monday's low. Calls were down over $1.
On 9 March I sold the calls for $3.26 and $4.00 during within the first 20min of market open. Even if price goes back over 134, IV and VIX may drop so I prefer to take this profit and focus on other trades.
Disclaimer
The information and publications are not meant to be, and do not constitute, financial, investment, trading, or other types of advice or recommendations supplied or endorsed by TradingView. Read more in the Terms of Use.
Disclaimer
The information and publications are not meant to be, and do not constitute, financial, investment, trading, or other types of advice or recommendations supplied or endorsed by TradingView. Read more in the Terms of Use.
