+
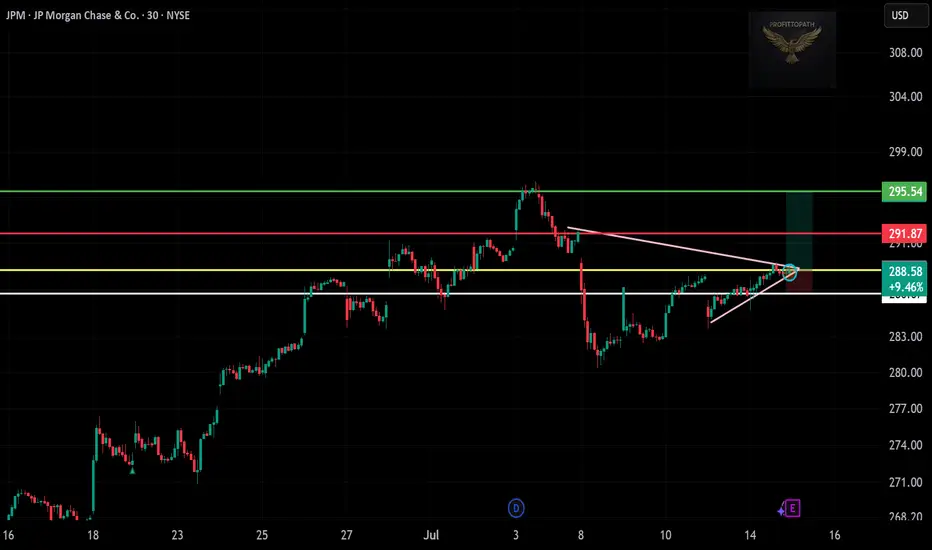
🧠 Chart Analysis Summary:
Pattern: Symmetrical triangle breakout has occurred. Momentum is building.
Current Price: $288.58
Breakout Confirmation: Price closed above resistance trendline (pink), signaling potential bullish move.
📊 Key Levels:
Entry Zone: $288.50–289.00
Resistance/Targets:
Minor Resistance: $291.87 (red line)
Main Target: $295.54 (green line)
Support Zone:
$284.00–285.00 (white zone, strong base)
🎯 Trade Plan (Bullish Setup):
Entry: $288.60
Target: $295.00–295.50
Stop-Loss: Below $284.00
Disclaimer
The information and publications are not meant to be, and do not constitute, financial, investment, trading, or other types of advice or recommendations supplied or endorsed by TradingView. Read more in the Terms of Use.
Disclaimer
The information and publications are not meant to be, and do not constitute, financial, investment, trading, or other types of advice or recommendations supplied or endorsed by TradingView. Read more in the Terms of Use.