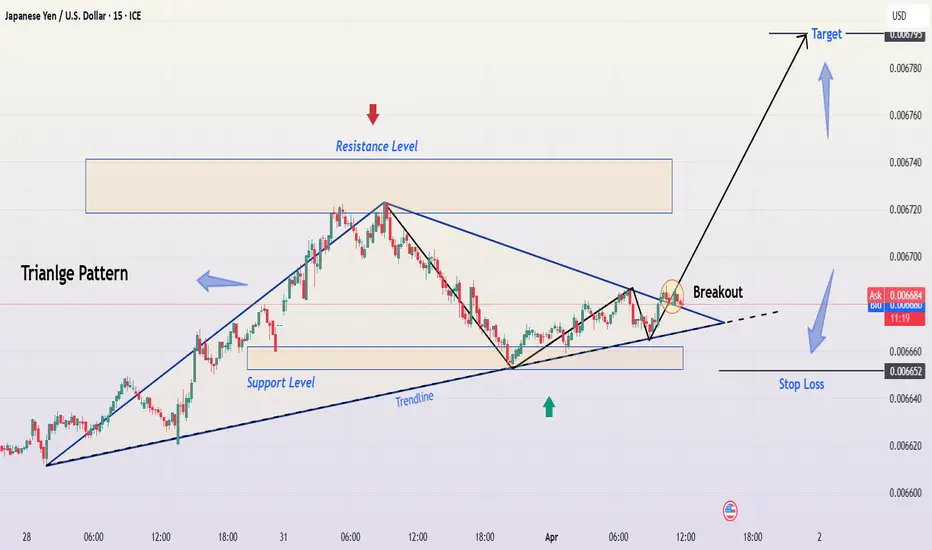
This TradingView chart represents a detailed technical analysis setup for the Japanese Yen (JPY) against the U.S. Dollar (USD). The main focus of the chart is a symmetrical triangle pattern breakout, a common formation that signals potential price movement.
In this detailed breakdown, we will analyze the following aspects:
Technical Pattern: Symmetrical Triangle Formation
Support and Resistance Levels
Breakout Confirmation
Trading Setup Explanation
Risk Management Strategy
Market Expectations (Bullish & Bearish Scenarios)
Conclusion & Trading Plan
1. Technical Pattern: Symmetrical Triangle Formation
The chart showcases a symmetrical triangle, which is a continuation pattern that typically occurs in trending markets. It indicates a period of consolidation where buyers and sellers struggle for dominance, leading to an eventual breakout.
Characteristics of the Symmetrical Triangle in This Chart:
Converging Trendlines:
The upper trendline (resistance) is sloping downward, showing lower highs.
The lower trendline (support) is sloping upward, showing higher lows.
Apex Formation:
As the price moves closer to the triangle's apex, volatility decreases, creating a squeeze effect.
Breakout Possibility:
Once price reaches a critical point, a breakout is expected in either direction.
Why is This Pattern Important?
Symmetrical triangles suggest that the market is indecisive, but once a breakout occurs, it can trigger a strong price movement.
Traders wait for the breakout direction to confirm the trade before entering a position.
2. Key Support and Resistance Levels
Support and resistance levels are crucial for identifying potential entry, stop-loss, and target areas.
Resistance Level:
A horizontal resistance zone (highlighted in beige) is drawn at the top.
This zone represents historical price rejection levels, where sellers have previously stepped in.
A confirmed breakout above this level would indicate strong bullish momentum.
Support Level:
The lower support zone (marked in blue) acts as a buying interest area.
Price has bounced off this zone multiple times, confirming it as a strong support level.
A break below this zone would signal a bearish reversal.
Trendline Support:
The lower boundary of the symmetrical triangle also acts as dynamic support.
If price respects this trendline, it suggests bullish strength leading to a breakout.
3. Breakout Confirmation & Market Reaction
The most important part of the setup is the breakout, which occurs when the price successfully moves beyond the triangle's trendline resistance.
Key Observations from the Chart:
Breakout Zone:
The breakout occurs near the right edge of the triangle (circled in red).
The price breaks above the upper trendline, confirming a bullish breakout.
Confirmation Candle:
A bullish candle follows the breakout, confirming buying pressure.
Traders should wait for a retest of the trendline before entering.
Volume Consideration:
Strong breakout moves are typically accompanied by a rise in volume, increasing the likelihood of follow-through.
4. Trading Setup Explanation
This trade follows a trend-following breakout strategy, where traders capitalize on price momentum after confirmation.
Entry Point:
The ideal entry is just above the breakout candle.
Traders can also wait for a retest of the broken trendline before entering.
Stop Loss Placement:
The stop loss is placed slightly below the previous swing low at 0.006652.
This prevents excessive drawdowns in case of a false breakout.
Profit Target Calculation:
The profit target is set at 0.006795, which is calculated based on:
The height of the triangle formation projected from the breakout point.
The next major resistance level, aligning with historical price action.
5. Risk Management Strategy
Risk management is a critical component of any trading strategy. Here’s how it is applied in this setup:
Risk-to-Reward Ratio (RRR):
A good trade setup maintains an RRR of at least 2:1.
If the stop loss is 33 pips (0.000033) and the target is 112 pips (0.000112), the RRR is 3:1, making this a high-probability trade.
Position Sizing Consideration:
Risk per trade should be limited to 1-2% of the total account balance.
Leverage should be used cautiously, as breakouts can sometimes retest the breakout zone before continuing.
6. Market Expectations (Bullish & Bearish Scenarios)
Bullish Scenario (Successful Breakout):
✅ If price sustains above the breakout level, it will likely continue to rally toward the target at 0.006795.
✅ A strong bullish momentum candle would confirm further buying pressure.
✅ If volume supports the breakout, trend continuation is highly probable.
Bearish Scenario (False Breakout or Reversal):
❌ If price falls back inside the triangle, it indicates a false breakout.
❌ If price closes below 0.006652, bears take control, and price may drop further.
❌ A breakdown below the support level would shift the market sentiment bearish.
7. Conclusion & Trading Plan
This chart presents a classic symmetrical triangle breakout trade with a clear entry, stop-loss, and target strategy.
Summary of Trading Plan:
Component Details
Pattern Symmetrical Triangle
Breakout Direction Bullish
Entry Point Above the breakout confirmation candle
Stop Loss 0.006652 (below support)
Take Profit (Target) 0.006795
Risk-to-Reward Ratio Favorable (3:1)
Market Bias Bullish (if price sustains above breakout)
Final Considerations:
Always wait for confirmation before entering.
Monitor volume and price action for additional validation.
Stick to the risk management plan to minimize losses.
If executed correctly, this setup offers a high-probability trade with a strong risk-to-reward ratio, making it a profitable trading opportunity in the JPY/USD market.
Related publications
Disclaimer
The information and publications are not meant to be, and do not constitute, financial, investment, trading, or other types of advice or recommendations supplied or endorsed by TradingView. Read more in the Terms of Use.
Related publications
Disclaimer
The information and publications are not meant to be, and do not constitute, financial, investment, trading, or other types of advice or recommendations supplied or endorsed by TradingView. Read more in the Terms of Use.