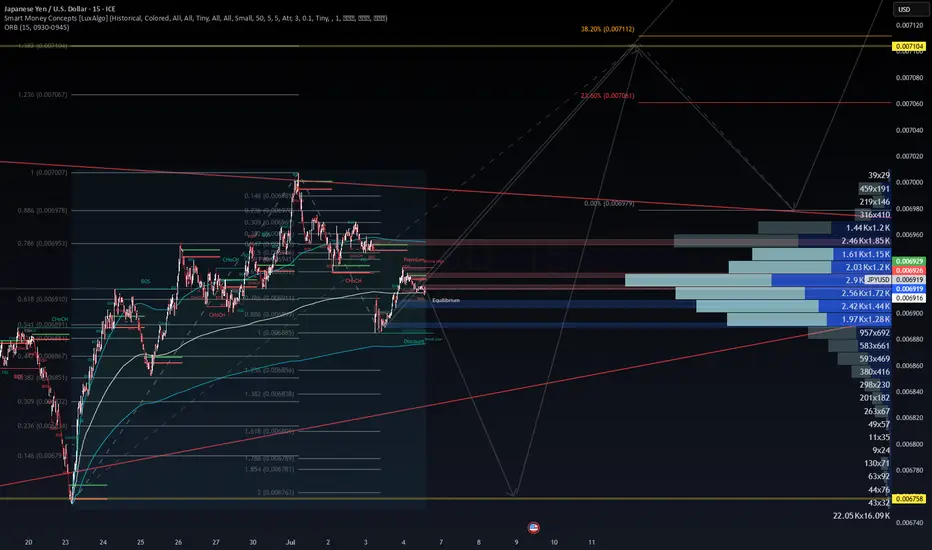
🧭 Directional Bias: Bullish Reversal from Discount Zone
📉 Current Price: 0.006919
🧠 Thesis:
Price reacted strongly from the Discount Wick Low Zone (≈ 0.006885–0.006856).
The current structure shows:
✅ CHoCH to the upside near the EQ
✅ Volume cluster support at 0.00691
🟦 Liquidity sweep occurred at prior lows.
Expecting a reversal back into Premium zone toward Fibonacci extension clusters near 0.00707–0.00711.
🎯 Trade Setup: Long JPY/USD (Short USD/JPY)
Element Value / Zone
Entry Zone 0.00691–0.00692 (Equilibrium / 0.618 Fib)
Stop Loss (SL) 0.006875 (below recent Discount Low / 0.786 Fib)
Take Profit 1 0.006978 (0.886 Fib / SMC Break level)
Take Profit 2 0.00707 (1.236 Fib / major OB target)
Take Profit 3 0.007112 (38.2% extension – long-term target)
Risk-Reward TP1 ≈ 2.3:1, TP2 ≈ 3.6:1, TP3 ≈ 5.4:1
🔍 Volume Profile Insight:
Heavy accumulation at:
0.00691 (high confluence of OB, Fib, and volume)
Above 0.00695, price enters "inefficient" zone → price may accelerate rapidly.
Most volume near 0.00692 confirms institutional interest.
🔐 Risk Management:
Max 1–2% capital exposure per position
Position sizing should reflect SL width of ~4.4 pips
Trailing stop once TP1 is reached to protect profits
🔄 Alternate Scenario (Invalidate if):
Price breaks and closes below 0.006875 with high volume
Then, revisit 0.006758 (Golden Zone) as next long accumulation zone
Consider reversing bias if a CHoCH to the downside occurs post TP1 rejection
⏱️ Timeframe:
Holding Period: 2–5 days (swing scalping opportunity)
Suitable for: CFD traders, JPY futures traders (e.g., J6), or FX options buyers
🔗 Suggested Option Strategy (for FX traders using options):
Bull Call Spread on JPYUSD=X or inverse Put Spread on USDJPY
Strike range: [0.00690–0.00707]
Expiry: July 12–19
✅ Summary:
Execute long from Equilibrium zone (~0.00691) toward 0.00707–0.00711. Strong confluence from Fib extensions, SMC structure, and volume profile validates a reversal.
Protect with tight SL under 0.006875. Scale out at key premiums.
Disclaimer
The information and publications are not meant to be, and do not constitute, financial, investment, trading, or other types of advice or recommendations supplied or endorsed by TradingView. Read more in the Terms of Use.
Disclaimer
The information and publications are not meant to be, and do not constitute, financial, investment, trading, or other types of advice or recommendations supplied or endorsed by TradingView. Read more in the Terms of Use.