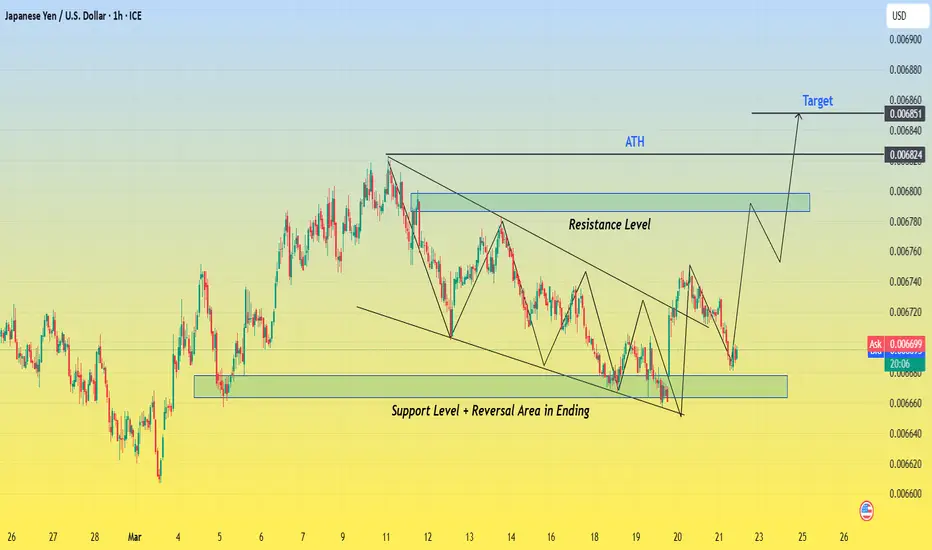
The JPY/USD 1-hour chart is displaying a well-defined falling wedge pattern, which is typically a bullish reversal setup. This pattern forms as price action moves within converging trendlines, indicating that selling pressure is gradually weakening. The breakout from this pattern signals a potential trend reversal, and the price may be heading toward key resistance zones and an eventual bullish target.
This analysis will break down the chart structure, market psychology, key levels, and a trading setup to help traders make an informed decision.
1. Understanding the Falling Wedge Pattern
The falling wedge is a common price action pattern characterized by:
🔹 Lower highs and lower lows forming within two downward-sloping trendlines.
🔹 Decreasing volume, indicating that sellers are losing momentum.
🔹 A breakout above the upper trendline, confirming a shift in trend and signaling the start of bullish momentum.
Market Psychology Behind the Wedge Pattern:
📉 During the wedge formation, the market is in a downtrend, and sellers are in control. However, with each new lower low, the price finds strong support, and buyers start stepping in.
📊 As the wedge narrows, the downward momentum weakens, and sellers struggle to push the price lower. Eventually, demand exceeds supply, leading to a breakout to the upside, which is exactly what we see on this chart.
2. Key Levels & Market Structure
🔹 Support Zone & Reversal Area:
The support zone between 0.006660 - 0.006680 acted as a strong demand area, preventing further downside.
This is also labeled as a reversal area, meaning buyers were aggressive in this zone.
The final touch at this support led to a strong bounce, initiating the breakout.
🔹 Resistance Level:
The price is now approaching a key resistance area at 0.006780 - 0.006800, which previously acted as a supply zone.
A break and retest of this level would further confirm bullish momentum.
🔹 All-Time High (ATH) & Target Level:
The ATH region is marked on the chart as a historical resistance level where price faced strong selling pressure before.
If the current breakout holds, price action could aim for the 0.006851 target level, completing the measured move from the wedge pattern.
3. Trading Strategy & Execution Plan
📈 Entry Strategy:
There are two main ways to enter this trade:
1️⃣ Aggressive Entry: Enter immediately after the breakout above the falling wedge.
2️⃣ Conservative Entry: Wait for a breakout AND retest of the previous resistance turned support (0.006780 zone) before entering long.
🔻 Stop-Loss Placement:
To manage risk, traders should consider placing stop-loss orders:
Below the previous support zone (0.006660) to minimize downside risk.
Alternatively, below the wedge breakout point if using a tight stop-loss.
🎯 Take-Profit Targets:
1️⃣ First Target: 0.006780 (near-term resistance level).
2️⃣ Final Target: 0.006851 (based on wedge breakout projection).
4. Confirmation & Risk Management
🔎 Key Confirmation Factors for a Strong Breakout:
✅ Price breaks above the falling wedge with strong bullish candles.
✅ Volume increases, showing strong buying interest.
✅ RSI or other momentum indicators confirm bullish divergence.
⚠️ Potential Risks to Consider:
False Breakout: If price falls back inside the wedge, this could invalidate the bullish setup.
Rejection at Resistance: If buyers fail to push price above the 0.006780 resistance, it could lead to another consolidation.
5. Final Thoughts & Trading Outlook
📌 This JPY/USD chart presents a high-probability bullish setup due to the breakout from a falling wedge pattern.
📌 The breakout, strong support zone, and bullish price action indicate further upside potential.
📌 Risk management is key—waiting for confirmation can increase the probability of success.
💡 Final Verdict: Bullish Bias – Watching for Retest & Continuation to Target! 🚀
Related publications
Disclaimer
The information and publications are not meant to be, and do not constitute, financial, investment, trading, or other types of advice or recommendations supplied or endorsed by TradingView. Read more in the Terms of Use.
Related publications
Disclaimer
The information and publications are not meant to be, and do not constitute, financial, investment, trading, or other types of advice or recommendations supplied or endorsed by TradingView. Read more in the Terms of Use.