🔍 Pattern Breakdown: Inverse Head & Shoulders (H&S)
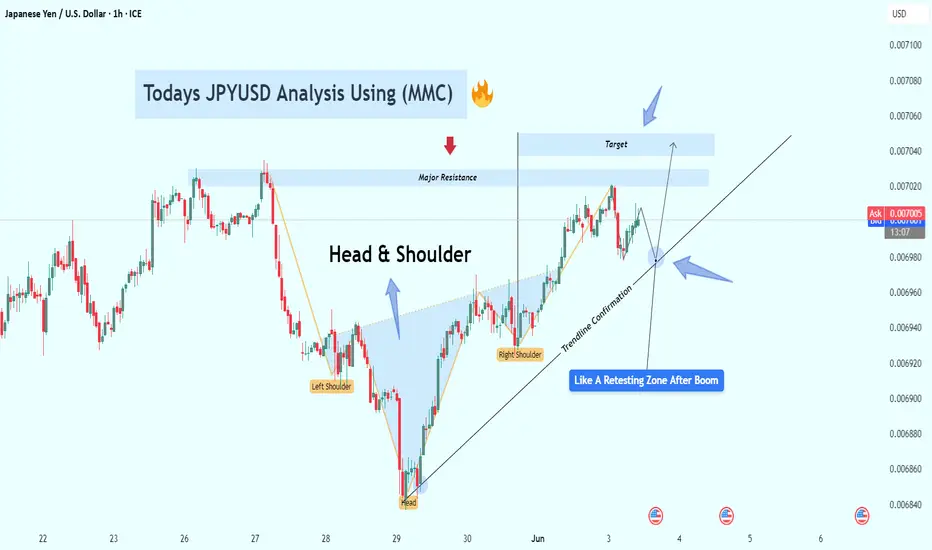
We’ve identified a textbook Inverse Head & Shoulders pattern, a classic bullish reversal formation that often appears at the end of a downtrend. Here's how the structure played out:
Left Shoulder:
The initial drop formed a local low, followed by a short recovery, creating the first "shoulder" on the left.
Head:
A deeper push down formed the lowest point of the pattern, indicating a possible trap for sellers or exhaustion in bearish momentum. This is the "head" and the key anchor of the pattern.
Right Shoulder:
A higher low forms, showing buyers stepping in earlier and with more strength. This symmetry confirms the structure and signals a potential reversal in trend.
Neckline:
Drawn across the highs between the shoulders, this key resistance line was broken decisively, confirming the bullish pattern and triggering an upward breakout.
📌 Trendline + Retest Zone = Confluence Support
After the breakout above the neckline:
Price surged strongly, showing confidence in the reversal.
It pulled back gently to retest the neckline, which now acts as support.
This retest also aligns with the upward trendline, adding confluence — a strong signal in technical trading that increases the probability of a successful continuation move.
This zone is labeled on the chart as:
🟦 “Like a Retesting Zone After Boom” — a perfect description of what’s occurring.
🎯 Target and Resistance Zones
The price is now moving toward a major resistance zone marked between 0.007020 – 0.007060, with a target zone slightly above at 0.007080.
These zones represent historical selling pressure or supply areas. A breakout above this region would open doors to even higher levels, signaling strong bullish continuation.
📈 Why This Setup Matters (MMC Strategy Applied)
Using the Market Mapping Concept (MMC) approach, this trade idea combines:
Market structure (Inverse H&S pattern)
Momentum confirmation (strong bullish move after breakout)
Zone mapping (support/resistance confluence)
Trendline validation (clean structure with pullback respect)
This creates a well-defined trade setup with clear entry and exit logic, excellent risk-to-reward potential, and technical confirmation.
✅ Summary: Bullish Outlook With Managed Risk
Bias: Bullish continuation as long as price holds above the neckline/trendline zone.
Confirmation: Inverse H&S pattern + successful retest.
Target: 0.007060–0.007080 resistance zone.
Invalidation: Break below 0.006980 and close under trendline support.
💬 Minds Post Caption (Extended)
🔥 JPYUSD Ready to Fly? Inverse Head & Shoulders Breakout Spotted!
Clean reversal pattern (H&S) just completed with a strong neckline breakout and a perfect retest at trendline confluence. MMC analysis suggests bullish continuation toward the 0.007060+ resistance zone. Classic "retest after boom" move. Watching price action closely! 🚀📊
For Daily Trade Setups and Forecast: 📈 t.me/xauusdoptimizer
Premium Signals Fr33: 💯 t.me/xauusdoptimizer
🥰🥳🤩
Premium Signals Fr33: 💯 t.me/xauusdoptimizer
🥰🥳🤩
Related publications
Disclaimer
The information and publications are not meant to be, and do not constitute, financial, investment, trading, or other types of advice or recommendations supplied or endorsed by TradingView. Read more in the Terms of Use.