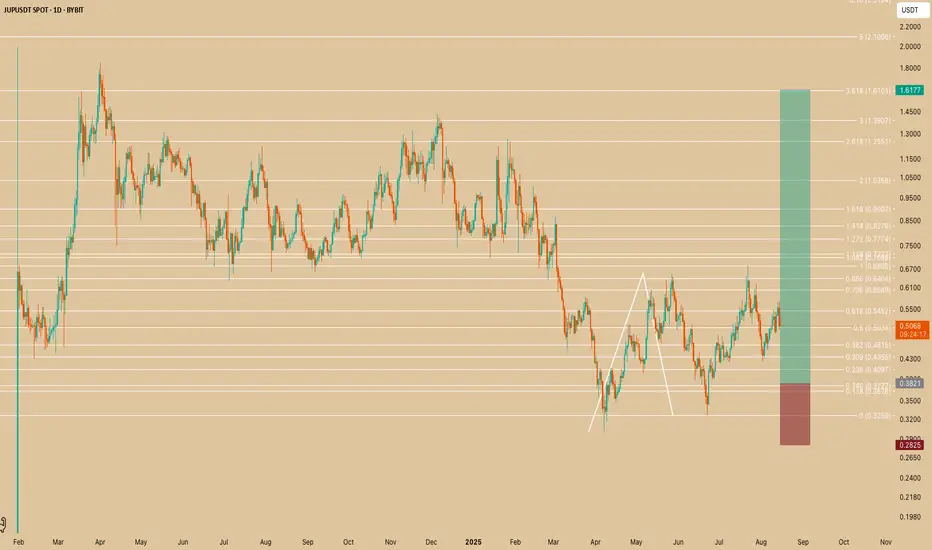
1. Chart Context
Pair: JUP/USDT (spot market on Bybit).
Timeframe: 1D (Daily candles) – suitable for swing trades lasting days to weeks.
Price: Currently around 0.5213 USDT, up +2.40% today.
Background: JUP had a strong rally earlier in the year, followed by consolidation and pullbacks.
2. Fibonacci Structure
The chart is covered with Fibonacci retracement and extension levels, which help identify support/resistance:
Retracements (0.236, 0.382, 0.5, 0.618, 0.786) show potential pullback zones.
Extensions (1.272, 1.618, 2, 2.618, 3.618, 5) project possible upside targets if price breaks higher.
The current price is above the 0.5 retracement (0.5022), aiming toward 0.618 retracement (0.5439).
3. Trade Idea Details
Entry Zone: Around current price 0.51–0.52 USDT after bouncing from mid-range Fibonacci support.
Stop Loss: 0.3084 USDT (below the 0.118 retracement), giving room for volatility.
Take Profit Zone: 1.3404 USDT, which is close to the 2.618 Fibonacci extension from the prior swing.
Risk-to-Reward Ratio: Very favorable (roughly 5:1+), meaning a small loss risk for a potentially large gain.
4. Trade Rationale
Technical: Price bounced from a key retracement zone and is attempting to reclaim higher Fibonacci levels.
Trend Context: After a long corrective phase, the market may be entering a new bullish swing phase.
Targets: Fibonacci extensions project significant upside potential if momentum continues.
5. Swing Trade Plan Summary
Bias: Bullish swing.
Entry: Buy in the 0.51–0.52 range.
Stop Loss: 0.3084 (below key support).
Targets: Gradual scaling out at 0.68, 0.90, 1.03, final target 1.34.
Risk Management: Risk only what you can afford to lose; this is a volatile asset.
Disclaimer
The information and publications are not meant to be, and do not constitute, financial, investment, trading, or other types of advice or recommendations supplied or endorsed by TradingView. Read more in the Terms of Use.
Disclaimer
The information and publications are not meant to be, and do not constitute, financial, investment, trading, or other types of advice or recommendations supplied or endorsed by TradingView. Read more in the Terms of Use.