📈
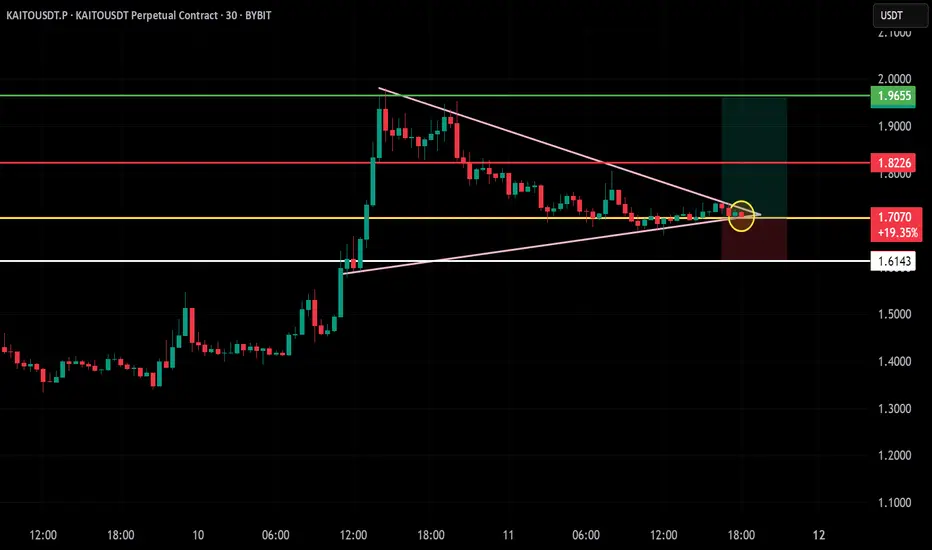
Timeframe: 30-Minute Chart
Pattern: Bullish descending triangle breakout
📌 Trade Plan
Entry Zone: Around $1.7062 (breakout confirmation)
Stop-Loss (SL): Below $1.6143 (previous swing low)
🎯 Take Profit Targets
TP1: $1.8226 – Previous resistance
TP2: $1.9655 – Pattern breakout projection
🔍 Technical Highlights
Breakout from descending triangle on rising trendline
Bullish candle with volume confirmation
Tight consolidation near breakout = ideal setup
📊 Risk-Reward Calculation
Risk: $1.7062 - $1.6143 = $0.0919
Reward to TP2: $1.9655 - $1.7062 = $0.2593
R:R Ratio ≈ 1:2.82
🚨 Execution Strategy
Enter above yellow zone after confirmed breakout
SL below trendline (white)
TP1 partial booking, let rest ride to TP2
Disclaimer
The information and publications are not meant to be, and do not constitute, financial, investment, trading, or other types of advice or recommendations supplied or endorsed by TradingView. Read more in the Terms of Use.
Disclaimer
The information and publications are not meant to be, and do not constitute, financial, investment, trading, or other types of advice or recommendations supplied or endorsed by TradingView. Read more in the Terms of Use.