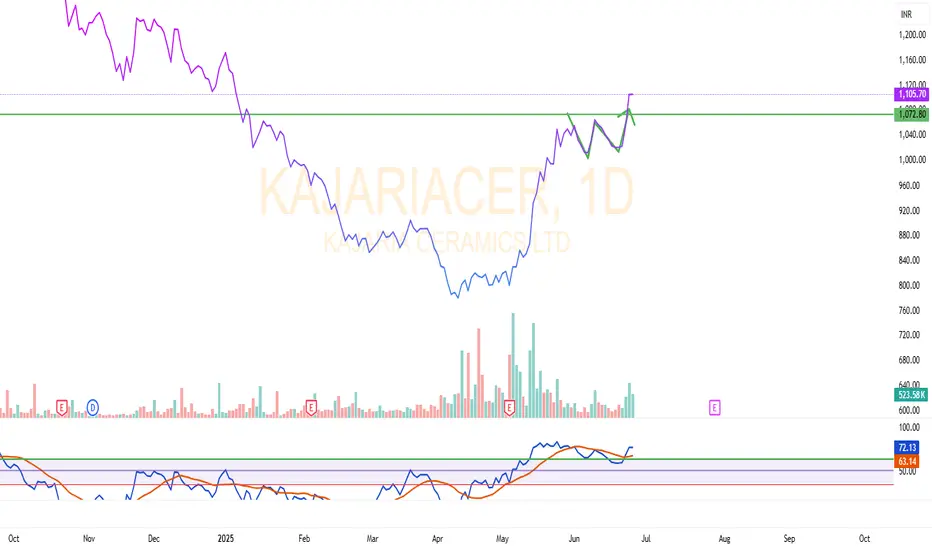
Stock: Kajaria Ceramics (NSE:KAJARIACER)
Timeframe: Daily Chart
Type: Positional Breakout Trade
🔍 Technical Breakdown:
✅ W Pattern Breakout:
Stock ne ₹1072.80 ke neckline par classic W (double bottom) pattern breakout diya hai.
✅ 200 EMA Crossover:
Price ne strong bullish momentum ke saath 200 EMA (around ₹1047.50) ko cross kiya hai — indicating trend reversal.
✅ Volume Confirmation:
Breakout candle ke saath decent volume activity dikhi gayi hai — bullish strength ka signal.
✅ Indicators Supportive:
RSI currently above 63 — showing strength, not yet overbought.
MACD crossover confirms bullish momentum.
📌 Trade Plan:
Entry (CMP): ₹1105.70
Buy on Retest Zone: ₹1072–1080
Stop Loss: ₹1040 (Below 200 EMA & W base)
Target 1: ₹1120
Target 2: ₹1160
Target 3: ₹1220
Risk-Reward: Minimum 1:2.5
🧠 Key Observations:
W Pattern breakout backed by trend shift & volume = strong setup.
Ideal positional setup for next 2–4 weeks.
Avoid fresh entry if closes below 200 EMA again.
Retest near ₹1070 can be used for better risk-reward entry.
📉 Chart Summary:
W Pattern ✅ | 200 EMA Break ✅ | Volume Support ✅ | RSI Strong ✅
🔔 Disclaimer: This is for educational purposes only. Not financial advice. Please do your own research or consult a SEBI-registered advisor.
Disclaimer
The information and publications are not meant to be, and do not constitute, financial, investment, trading, or other types of advice or recommendations supplied or endorsed by TradingView. Read more in the Terms of Use.
Disclaimer
The information and publications are not meant to be, and do not constitute, financial, investment, trading, or other types of advice or recommendations supplied or endorsed by TradingView. Read more in the Terms of Use.