Technical Analysis of KASPY (KASPY/USD) BY BLAŽ FABJAN
1. Price Action & Trend Structure:
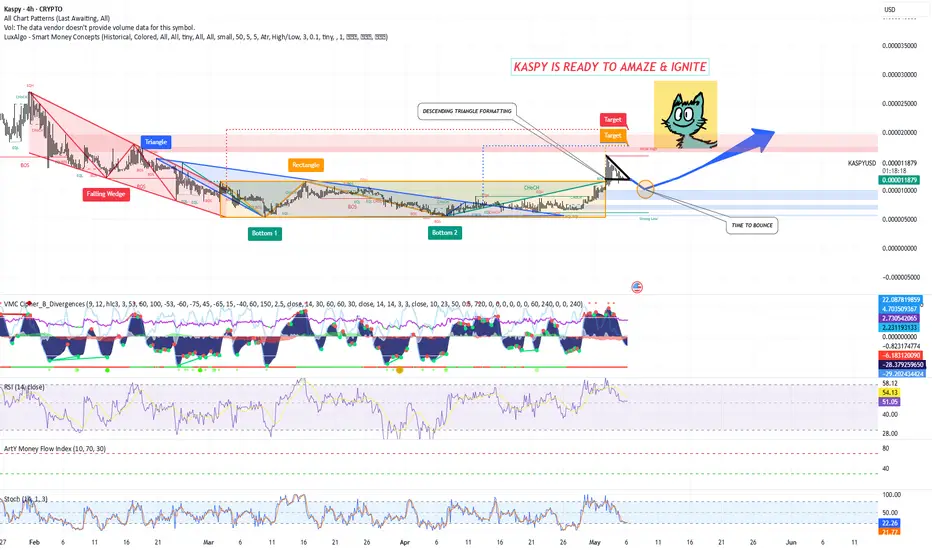
Falling Wedge (Red Zone): The chart shows a classic falling wedge pattern, a bullish reversal formation. This indicates that the downtrend has slowed down, and a breakout could be imminent.
Descending Triangle (Top Right Zone): This descending triangle formation suggests consolidation near resistance. If KASPY breaks out above the horizontal line of the triangle, a move towards higher targets can be expected.
2. Key Support and Resistance Levels:
Bottom 1 (Green Box): A significant support zone that previously bounced the price upwards. This zone should hold if the price tests it again.
Bottom 2 (Green Box): Another crucial support level showing a potential buying area. This could act as a safety net in case the market dips.
Resistance Levels (Red and Blue Targets): The upper red zone represents significant resistance, where the price might face selling pressure. The chart shows targets aligned with these resistance zones.
3. Technical Indicators:
VMC Clipser (B Divergences): The indicator shows mixed signals with a divergence in the upward movement, suggesting potential reversal or continuation. The positive divergence is noted with green arrows indicating buying opportunities.
RSI (Relative Strength Index): RSI is at 50.97, indicating neutral market conditions. It is not overbought or oversold, which suggests that there is room for price action in either direction.
Money Flow Index (MFI): The MFI value is 54.13, which confirms that there is moderate buying interest. MFI values above 50 suggest positive money flow, supporting potential upside movement.
Stochastic Oscillator: The stochastic oscillator shows a level of 21.93, indicating an oversold condition. This could signal an upward bounce as the market may be ready to reverse.
4. Market Sentiment & Time to Bounce:
The chart annotation “Time to Bounce” suggests a potential upward price movement after consolidating within the rectangle and descending triangle formation. The market sentiment appears to favor a bullish breakout.
Trading Plan
Entry Points:
Primary Entry: If KASPY breaks above the upper boundary of the descending triangle, targeting the breakout point at around 0.0000020 (upper resistance zone), this could be the ideal entry point for a bullish trade.
Secondary Entry (Bounce Play): If the price approaches the support areas (Bottom 1 or Bottom 2), consider entering long positions as the price bounces upward off these zones. The oversold conditions in the stochastic oscillator provide confidence for a potential bounce.
Target Levels:
Target 1: Around the upper red zone resistance (0.0000020), which has already been marked as a target in the chart.
Target 2: The second resistance zone at 0.0000025, aligning with the overall market conditions.
Long-term Target: A breakout could send the price higher to 0.0000035 (or higher), depending on the strength of the breakout.
Stop Loss & Risk Management:
Stop Loss: Place stop loss orders below the support level (around 0.0000015) to minimize losses if the price fails to hold at support. A tighter stop loss could be placed just below the bottom of the falling wedge.
Risk-to-Reward Ratio: Aim for at least a 3:1 risk-to-reward ratio for this trade, ensuring that the potential profit justifies the risk taken.
The KASPY chart shows a favorable setup for a potential bullish move, with a falling wedge pattern and a descending triangle indicating a possible breakout. Key indicators support this outlook, with neutral RSI and a favorable stochastic reading. The trading plan includes strategic entry points, realistic target levels, and prudent risk management.
1. Price Action & Trend Structure:
Falling Wedge (Red Zone): The chart shows a classic falling wedge pattern, a bullish reversal formation. This indicates that the downtrend has slowed down, and a breakout could be imminent.
Descending Triangle (Top Right Zone): This descending triangle formation suggests consolidation near resistance. If KASPY breaks out above the horizontal line of the triangle, a move towards higher targets can be expected.
2. Key Support and Resistance Levels:
Bottom 1 (Green Box): A significant support zone that previously bounced the price upwards. This zone should hold if the price tests it again.
Bottom 2 (Green Box): Another crucial support level showing a potential buying area. This could act as a safety net in case the market dips.
Resistance Levels (Red and Blue Targets): The upper red zone represents significant resistance, where the price might face selling pressure. The chart shows targets aligned with these resistance zones.
3. Technical Indicators:
VMC Clipser (B Divergences): The indicator shows mixed signals with a divergence in the upward movement, suggesting potential reversal or continuation. The positive divergence is noted with green arrows indicating buying opportunities.
RSI (Relative Strength Index): RSI is at 50.97, indicating neutral market conditions. It is not overbought or oversold, which suggests that there is room for price action in either direction.
Money Flow Index (MFI): The MFI value is 54.13, which confirms that there is moderate buying interest. MFI values above 50 suggest positive money flow, supporting potential upside movement.
Stochastic Oscillator: The stochastic oscillator shows a level of 21.93, indicating an oversold condition. This could signal an upward bounce as the market may be ready to reverse.
4. Market Sentiment & Time to Bounce:
The chart annotation “Time to Bounce” suggests a potential upward price movement after consolidating within the rectangle and descending triangle formation. The market sentiment appears to favor a bullish breakout.
Trading Plan
Entry Points:
Primary Entry: If KASPY breaks above the upper boundary of the descending triangle, targeting the breakout point at around 0.0000020 (upper resistance zone), this could be the ideal entry point for a bullish trade.
Secondary Entry (Bounce Play): If the price approaches the support areas (Bottom 1 or Bottom 2), consider entering long positions as the price bounces upward off these zones. The oversold conditions in the stochastic oscillator provide confidence for a potential bounce.
Target Levels:
Target 1: Around the upper red zone resistance (0.0000020), which has already been marked as a target in the chart.
Target 2: The second resistance zone at 0.0000025, aligning with the overall market conditions.
Long-term Target: A breakout could send the price higher to 0.0000035 (or higher), depending on the strength of the breakout.
Stop Loss & Risk Management:
Stop Loss: Place stop loss orders below the support level (around 0.0000015) to minimize losses if the price fails to hold at support. A tighter stop loss could be placed just below the bottom of the falling wedge.
Risk-to-Reward Ratio: Aim for at least a 3:1 risk-to-reward ratio for this trade, ensuring that the potential profit justifies the risk taken.
The KASPY chart shows a favorable setup for a potential bullish move, with a falling wedge pattern and a descending triangle indicating a possible breakout. Key indicators support this outlook, with neutral RSI and a favorable stochastic reading. The trading plan includes strategic entry points, realistic target levels, and prudent risk management.
Disclaimer
The information and publications are not meant to be, and do not constitute, financial, investment, trading, or other types of advice or recommendations supplied or endorsed by TradingView. Read more in the Terms of Use.
Disclaimer
The information and publications are not meant to be, and do not constitute, financial, investment, trading, or other types of advice or recommendations supplied or endorsed by TradingView. Read more in the Terms of Use.