Symmetrical Triangle Pattern:
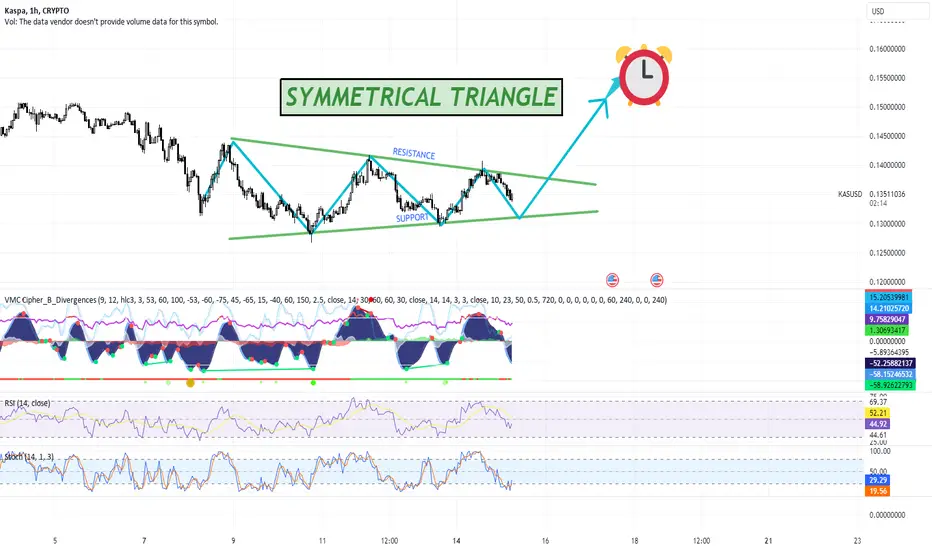
In the image, a symmetrical triangle has formed on the KAS/USD chart, indicating a period of consolidation. This pattern suggests that neither the bulls nor the bears are in control, and a breakout could occur in either direction.
Resistance is shown as the upper trendline, which has seen multiple rejections of price moving higher.
Support is established by the lower trendline, providing a floor for price movements.
Price Action:
The current price is hovering near the lower support of the triangle ($0.135) after testing the resistance level.
A bounce from this level could push the price towards the upper boundary of the triangle.
Once price consolidates further within the triangle, a breakout is expected.
Indicators:
VMC Cipher B (Volatility and Momentum): Shows that momentum has been fluctuating within this consolidation period. The indicator reveals divergences, which could signal potential reversals or trend continuations.
RSI (Relative Strength Index): Currently around 45, suggesting the market is in a neutral state. There is no immediate overbought or oversold signal, which aligns with the symmetrical triangle's nature.
Stochastic Oscillator: The Stochastic (shown in the lower panel) is just emerging from oversold conditions, indicating the possibility of an upward movement, aligning with the expectation of a potential upward breakout.
Volume Analysis:
Though volume data is not provided in the chart, typically, symmetrical triangles see decreasing volume during consolidation and a spike in volume at the breakout.
Professional Trading Plan
Entry Strategy:
Aggressive Entry: Buy near the lower trendline support (~$0.130 - $0.135). This provides an optimal risk-reward setup, as the price could potentially rebound from this area.
Conservative Entry: Wait for a confirmed breakout from the triangle's resistance or support with increased volume. If the price breaks above $0.140 with strong momentum, initiate a long position. For bearish confirmation, if it breaks below $0.125, consider shorting.
Exit Strategy:
Profit Target for Bullish Breakout: Measure the height of the triangle and project that onto the breakout point. The expected upward price target is approximately $0.155 to $0.160.
Profit Target for Bearish Breakout: If the triangle breaks downward, a short position target could be $0.120 to $0.115.
Stop Loss:
For a Long Position: Place a stop loss slightly below the support trendline (around $0.125). This minimizes risk if the price breaks below the triangle.
For a Short Position: Place a stop loss slightly above the resistance trendline (around $0.142). This minimizes risk if the price breaks upward unexpectedly.
Risk Management:
Always keep a risk-reward ratio of at least 1:2. Risking 1% of your capital should aim to generate a 2% or higher return.
Adjust position sizes according to account size and overall risk tolerance.
Monitoring:
Keep an eye on the RSI and Stochastic Oscillator for further confirmation of price movement.
Volume is critical; a breakout without volume may lead to false signals.
Regularly monitor any news events or major market movements that could impact cryptocurrency sentiment.
Conclusion:
Bullish Scenario: If KAS/USD successfully breaks through the resistance line, there is strong potential for a continuation to the $0.155 range.
Bearish Scenario: If the support breaks, a downward move towards $0.120 is possible.
This trading plan provides a structured approach, balancing risk and reward effectively while following the chart's technical setup.
Disclaimer
The information and publications are not meant to be, and do not constitute, financial, investment, trading, or other types of advice or recommendations supplied or endorsed by TradingView. Read more in the Terms of Use.
Disclaimer
The information and publications are not meant to be, and do not constitute, financial, investment, trading, or other types of advice or recommendations supplied or endorsed by TradingView. Read more in the Terms of Use.