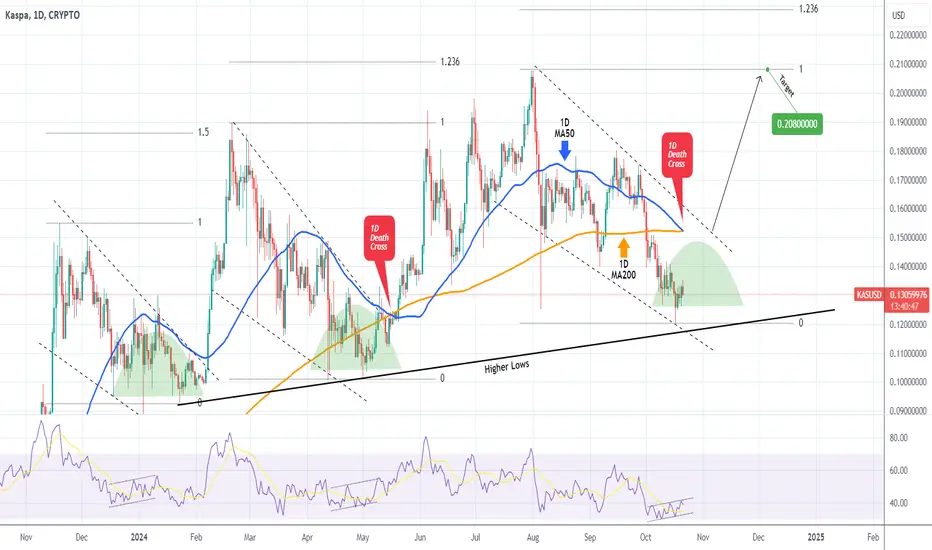
KASPA (KASUSD) has been trading within a Falling Wedge pattern since the July 31 top and is almost on the Higher Lows trend-line that started on the January 23 2024 Low. The key development of the day however, is the formation of the 1D Death Cross, a technically bearish pattern.
Last time it was formed though (May 16), it provided the basis for a strong rally that made a new High. Interestingly enough, the price was also coming off a Falling Wedge at the time that successfully broke above its top. In the meantime the 1D RSI was after a Bullish Divergence, essentially a bottoming process. In fact, it was the same formation of that the Falling Wedge before it (November - December 2023) had, that also broke aggressively above its top.
As a result, we have a potential triple bullish signal and as long as the Higher Lows hold, there are high probabilities of seeing the price break above the Wedge and target at least the previous High at 0.20800.
-------------------------------------------------------------------------------
** Please LIKE 👍, FOLLOW ✅, SHARE 🙌 and COMMENT ✍ if you enjoy this idea! Also share your ideas and charts in the comments section below! This is best way to keep it relevant, support us, keep the content here free and allow the idea to reach as many people as possible. **
-------------------------------------------------------------------------------
💸💸💸💸💸💸
👇 👇 👇 👇 👇 👇
👑Best Signals (Forex/Crypto+70% accuracy) & Account Management (+20% profit/month on 10k accounts)
💰Free Channel t.me/tradingshotglobal
🤵Contact info@tradingshot.com t.me/tradingshot
🔥New service: next X100 crypto GEMS!
💰Free Channel t.me/tradingshotglobal
🤵Contact info@tradingshot.com t.me/tradingshot
🔥New service: next X100 crypto GEMS!
Disclaimer
The information and publications are not meant to be, and do not constitute, financial, investment, trading, or other types of advice or recommendations supplied or endorsed by TradingView. Read more in the Terms of Use.