Weekly TF
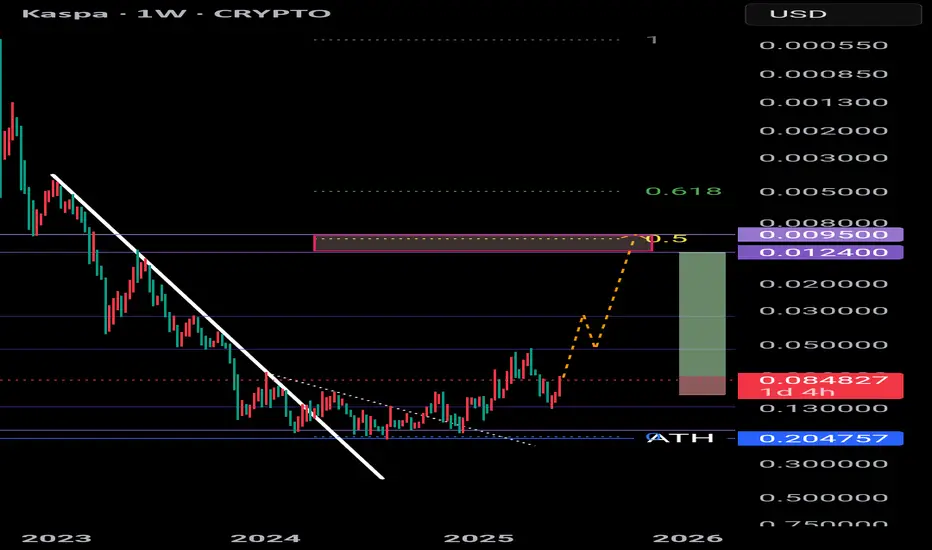
Chart inverted
Looking at this chart - what would you do here? Kaspa has been unable to exceed the $0.19 - 0.20 high. And has broken below 2 x key trend lines.
I seem to be missing some historical data on this chart but if we use the lowest price point and use a fibbonahi retracement tool, the 0.5 puts is roughly $0.010 - 0.012. Equal to a 80-90% drop.
If KAS sees continuation to the downside I believe this is where price could head next 📉
This coin had a good run for c.700 days, followed by 200 days of flat p.a. /consolidation - it makes sense that there would be a significant correction.
Disclaimer
The information and publications are not meant to be, and do not constitute, financial, investment, trading, or other types of advice or recommendations supplied or endorsed by TradingView. Read more in the Terms of Use.
Disclaimer
The information and publications are not meant to be, and do not constitute, financial, investment, trading, or other types of advice or recommendations supplied or endorsed by TradingView. Read more in the Terms of Use.