Key Levels on the Chart:
Broken Resistance Turned Support:
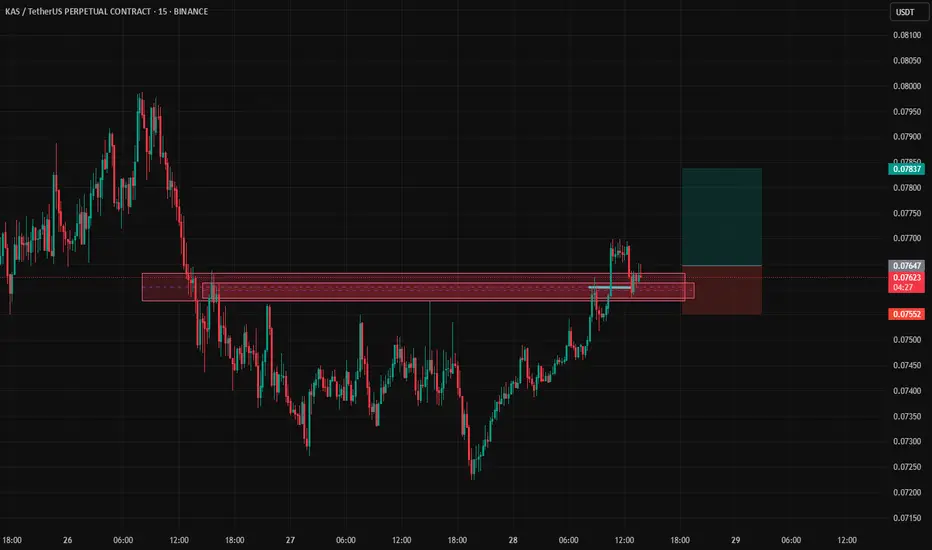
Around the 0.07520 – 0.07600 zone, there was a significant resistance area that has now been broken and is acting as new support (shown as a red box on the chart). Price broke above it with a strong candle and is currently consolidating above this zone.
Current Price Level:
The current price shown on the chart is 0.07647, sitting above the new support zone. This indicates buyers are still in control in the short term.
Target Area:
The green box on the chart marks a potential target zone, approximately around 0.07900 – 0.08000.
Stop Loss:
The stop-loss zone is set below the support area (within the red box), likely around 0.07520.
Technical Summary
The short-term trend on the 30-minute chart is bullish.
A confirmed breakout above resistance suggests potential continuation upward.
As long as price stays above ~0.07600, targets near 0.07900 – 0.08000 are reasonable.
A drop back below ~0.07520 would invalidate the bullish setup and could trigger a deeper correction.
Trading Perspective
✅ If you’re already in a long trade around 0.07620 – 0.07640:
Keep your stop-loss below 0.07520.
Reasonable target is 0.07900 – 0.08000.
If candles start closing weakly back below the support zone, consider exiting early.
⚠️ Important Note:
Volume was strong on the breakout candle but has decreased slightly afterward. If volume remains low, there’s a risk of a deeper pullback.
Since this is a lower timeframe, price can be volatile, so always manage your risk properly.
Broken Resistance Turned Support:
Around the 0.07520 – 0.07600 zone, there was a significant resistance area that has now been broken and is acting as new support (shown as a red box on the chart). Price broke above it with a strong candle and is currently consolidating above this zone.
Current Price Level:
The current price shown on the chart is 0.07647, sitting above the new support zone. This indicates buyers are still in control in the short term.
Target Area:
The green box on the chart marks a potential target zone, approximately around 0.07900 – 0.08000.
Stop Loss:
The stop-loss zone is set below the support area (within the red box), likely around 0.07520.
Technical Summary
The short-term trend on the 30-minute chart is bullish.
A confirmed breakout above resistance suggests potential continuation upward.
As long as price stays above ~0.07600, targets near 0.07900 – 0.08000 are reasonable.
A drop back below ~0.07520 would invalidate the bullish setup and could trigger a deeper correction.
Trading Perspective
✅ If you’re already in a long trade around 0.07620 – 0.07640:
Keep your stop-loss below 0.07520.
Reasonable target is 0.07900 – 0.08000.
If candles start closing weakly back below the support zone, consider exiting early.
⚠️ Important Note:
Volume was strong on the breakout candle but has decreased slightly afterward. If volume remains low, there’s a risk of a deeper pullback.
Since this is a lower timeframe, price can be volatile, so always manage your risk properly.
Disclaimer
The information and publications are not meant to be, and do not constitute, financial, investment, trading, or other types of advice or recommendations supplied or endorsed by TradingView. Read more in the Terms of Use.
Disclaimer
The information and publications are not meant to be, and do not constitute, financial, investment, trading, or other types of advice or recommendations supplied or endorsed by TradingView. Read more in the Terms of Use.