KASPA (KASUSDT) Technical Analysis — 1D Chart by Blaž Fabjan
Date: May 19, 2025
Exchange: KUCOIN
Pair: KAS/USDT
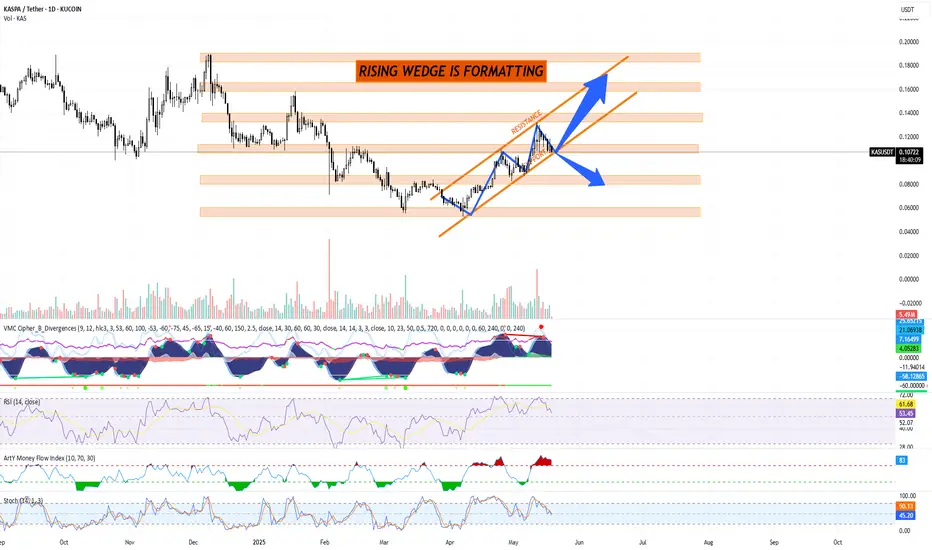
Chart Pattern: Rising Wedge (Bearish Reversal Signal)
A rising wedge is currently forming — characterized by converging trendlines sloping upward.
Support and Resistance levels are clearly outlined in the orange zones.
This pattern often signals a potential breakdown, but an upward breakout is possible with strong momentum.
Key Technical Indicators
1. Volume
Recent volume surge on uptrend suggests buying interest, but declining volume into the wedge tip hints at a possible exhaustion.
2. VMC Cipher B Divergences
Signs of bearish divergence forming; red dots and momentum wave flattening may signal weakening bullish strength.
3. RSI (14)
RSI at 53.27: In neutral territory. Slight bearish divergence observed from recent peaks. Watch for a move below 50 as a confirmation of bearish pressure.
4. Money Flow Index (MFI)
MFI at 83 (overbought zone): Indicates that buying pressure may soon fade, increasing the probability of a correction.
5. Stochastic RSI (14, 3, 3)
Stochastic RSI near 44–49 and crossing downward: Signaling a potential short-term correction.
Key Support & Resistance Zones
🟧 Resistance Levels:
$0.12 – $0.14 (current wedge resistance zone)
$0.16 – $0.18 (next target on bullish breakout)
$0.20+ (major resistance if trend continues)
🟧 Support Levels:
$0.10 (critical support)
$0.08 – $0.09 (wedge breakdown target)
$0.065 – $0.07 (strong demand zone)
Trading Plan for KASPA (KAS/USDT)
Bullish Scenario (Breakout Upwards)
Entry: Above $0.115 with strong volume confirmation
Targets:
TP1: $0.14
TP2: $0.165
TP3: $0.20
Stop-Loss: Below $0.10 (to invalidate wedge structure)
Bearish Scenario (Breakdown)
Entry: Below $0.10 (support break)
Targets:
TP1: $0.085
TP2: $0.072
TP3: $0.065
Stop-Loss: Above $0.11
Neutral/Range Strategy
If KAS trades between $0.10–$0.115 with low volume:
Avoid entry.
Wait for breakout or breakdown confirmation.
Risk Management
Risk/Reward Ratio: Minimum 2:1
Capital Allocation: Max 2–3% of portfolio per trade
Use limit orders to control entry points, especially due to high volatility in crypto markets.
The rising wedge pattern is often a precursor to downside in crypto.
However, macro bullish news, network upgrades, or volume surges may invalidate the bearish setup.
Traders should remain flexible and monitor volume, RSI, and support zones for any signs of reversal.
Date: May 19, 2025
Exchange: KUCOIN
Pair: KAS/USDT
Chart Pattern: Rising Wedge (Bearish Reversal Signal)
A rising wedge is currently forming — characterized by converging trendlines sloping upward.
Support and Resistance levels are clearly outlined in the orange zones.
This pattern often signals a potential breakdown, but an upward breakout is possible with strong momentum.
Key Technical Indicators
1. Volume
Recent volume surge on uptrend suggests buying interest, but declining volume into the wedge tip hints at a possible exhaustion.
2. VMC Cipher B Divergences
Signs of bearish divergence forming; red dots and momentum wave flattening may signal weakening bullish strength.
3. RSI (14)
RSI at 53.27: In neutral territory. Slight bearish divergence observed from recent peaks. Watch for a move below 50 as a confirmation of bearish pressure.
4. Money Flow Index (MFI)
MFI at 83 (overbought zone): Indicates that buying pressure may soon fade, increasing the probability of a correction.
5. Stochastic RSI (14, 3, 3)
Stochastic RSI near 44–49 and crossing downward: Signaling a potential short-term correction.
Key Support & Resistance Zones
🟧 Resistance Levels:
$0.12 – $0.14 (current wedge resistance zone)
$0.16 – $0.18 (next target on bullish breakout)
$0.20+ (major resistance if trend continues)
🟧 Support Levels:
$0.10 (critical support)
$0.08 – $0.09 (wedge breakdown target)
$0.065 – $0.07 (strong demand zone)
Trading Plan for KASPA (KAS/USDT)
Bullish Scenario (Breakout Upwards)
Entry: Above $0.115 with strong volume confirmation
Targets:
TP1: $0.14
TP2: $0.165
TP3: $0.20
Stop-Loss: Below $0.10 (to invalidate wedge structure)
Bearish Scenario (Breakdown)
Entry: Below $0.10 (support break)
Targets:
TP1: $0.085
TP2: $0.072
TP3: $0.065
Stop-Loss: Above $0.11
Neutral/Range Strategy
If KAS trades between $0.10–$0.115 with low volume:
Avoid entry.
Wait for breakout or breakdown confirmation.
Risk Management
Risk/Reward Ratio: Minimum 2:1
Capital Allocation: Max 2–3% of portfolio per trade
Use limit orders to control entry points, especially due to high volatility in crypto markets.
The rising wedge pattern is often a precursor to downside in crypto.
However, macro bullish news, network upgrades, or volume surges may invalidate the bearish setup.
Traders should remain flexible and monitor volume, RSI, and support zones for any signs of reversal.
Disclaimer
The information and publications are not meant to be, and do not constitute, financial, investment, trading, or other types of advice or recommendations supplied or endorsed by TradingView. Read more in the Terms of Use.
Disclaimer
The information and publications are not meant to be, and do not constitute, financial, investment, trading, or other types of advice or recommendations supplied or endorsed by TradingView. Read more in the Terms of Use.