TECHNICAL ANALYSIS – KASPA/USDT (Daily Chart)
Chart Pattern & Price Action:
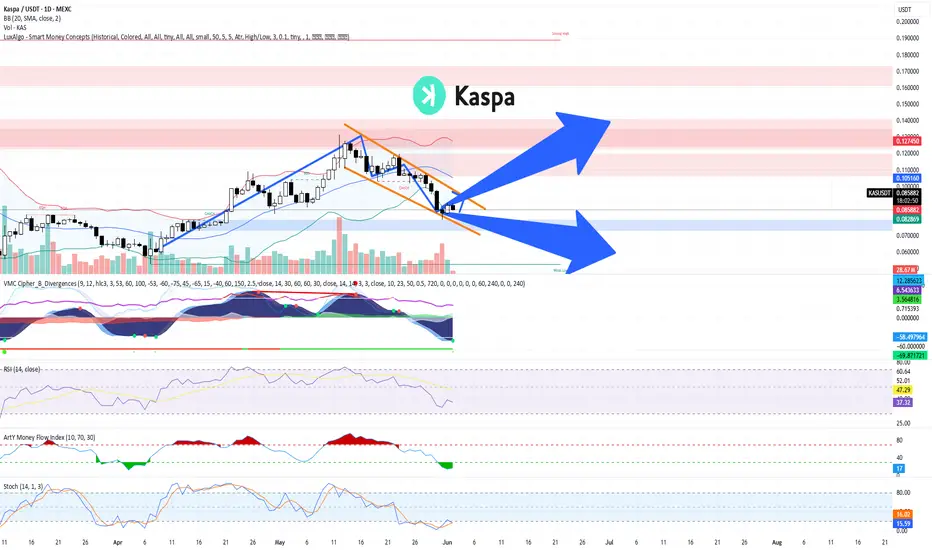
Descending Channel (Falling Wedge): KASPA has been trading within a falling wedge pattern, typically a bullish reversal setup.
Breakout Zone Approaching: Price is currently testing the upper resistance of the wedge (~$0.086–$0.088). A breakout from this level may indicate trend reversal.
Key Resistance Zone:
$0.105 – $0.127: Significant supply area (marked in red). Previously rejected, it is the next target if price breaks out upward.
Support Zone:
$0.073 – $0.082: Demand zone. Coincides with the Bollinger Band lower range and historical support.
Indicators Overview:
Bollinger Bands:
Price is trading at or near the middle band, showing a neutral-to-slightly bearish bias.
A breakout above the upper band (~$0.0895) could trigger bullish momentum.
MACD (VMC Cipher_B_Divergences):
Strong bearish momentum continues, but we can observe potential bullish divergence forming.
Green dot signal at the bottom may indicate a possible local bottom.
RSI (Relative Strength Index):
Currently at 37.06, near oversold territory.
Could signal a bounce if RSI climbs above 40 and confirms strength.
Money Flow Index (Art’ Money Flow):
MFI is deep in negative; however, these levels often precede trend reversals.
Watch for a crossover into positive territory as confirmation.
Stochastic RSI:
Bullish crossover around 14.53 / 15.67 in the oversold zone.
Early sign of potential short-term bounce.
TRADING PLAN
Entry Points:
Zone Type Price Range Reason
Buy Spot 1 Conservative $0.073 – $0.082 Strong historical support & bottom of wedge
Buy Spot 2 Aggressive ~$0.086 – $0.089 Breakout of descending wedge
Buy Spot 3 Momentum Break above $0.105 Bullish confirmation + breakout of major resistance
Take Profit Zones:
TP Level Price Notes
TP1 $0.105 First resistance / psychological level
TP2 $0.127 Strong resistance – expect rejection here
TP3 $0.15–0.16 Major extension target if strong momentum
Stop-Loss Strategy:
Strategy Type Placement
Conservative Below $0.073
Aggressive Below $0.080
Risk Management:
Use position sizing relative to account size (e.g., 1–3% risk per trade).
Adjust stop-loss dynamically if entering at breakout.
Combine with on-chain metrics or volume spikes for higher conviction.
SCENARIOS:
🔼 Bullish Scenario (Blue Up Arrow):
Breakout above wedge → retest → rally toward $0.105+
Break $0.105 confirms macro uptrend continuation
🔽 Bearish Scenario (Blue Down Arrow):
Rejection at wedge top → breakdown of $0.082 → revisit $0.073 support
Below $0.073 would invalidate short-term bullish structure
Chart Pattern & Price Action:
Descending Channel (Falling Wedge): KASPA has been trading within a falling wedge pattern, typically a bullish reversal setup.
Breakout Zone Approaching: Price is currently testing the upper resistance of the wedge (~$0.086–$0.088). A breakout from this level may indicate trend reversal.
Key Resistance Zone:
$0.105 – $0.127: Significant supply area (marked in red). Previously rejected, it is the next target if price breaks out upward.
Support Zone:
$0.073 – $0.082: Demand zone. Coincides with the Bollinger Band lower range and historical support.
Indicators Overview:
Bollinger Bands:
Price is trading at or near the middle band, showing a neutral-to-slightly bearish bias.
A breakout above the upper band (~$0.0895) could trigger bullish momentum.
MACD (VMC Cipher_B_Divergences):
Strong bearish momentum continues, but we can observe potential bullish divergence forming.
Green dot signal at the bottom may indicate a possible local bottom.
RSI (Relative Strength Index):
Currently at 37.06, near oversold territory.
Could signal a bounce if RSI climbs above 40 and confirms strength.
Money Flow Index (Art’ Money Flow):
MFI is deep in negative; however, these levels often precede trend reversals.
Watch for a crossover into positive territory as confirmation.
Stochastic RSI:
Bullish crossover around 14.53 / 15.67 in the oversold zone.
Early sign of potential short-term bounce.
TRADING PLAN
Entry Points:
Zone Type Price Range Reason
Buy Spot 1 Conservative $0.073 – $0.082 Strong historical support & bottom of wedge
Buy Spot 2 Aggressive ~$0.086 – $0.089 Breakout of descending wedge
Buy Spot 3 Momentum Break above $0.105 Bullish confirmation + breakout of major resistance
Take Profit Zones:
TP Level Price Notes
TP1 $0.105 First resistance / psychological level
TP2 $0.127 Strong resistance – expect rejection here
TP3 $0.15–0.16 Major extension target if strong momentum
Stop-Loss Strategy:
Strategy Type Placement
Conservative Below $0.073
Aggressive Below $0.080
Risk Management:
Use position sizing relative to account size (e.g., 1–3% risk per trade).
Adjust stop-loss dynamically if entering at breakout.
Combine with on-chain metrics or volume spikes for higher conviction.
SCENARIOS:
🔼 Bullish Scenario (Blue Up Arrow):
Breakout above wedge → retest → rally toward $0.105+
Break $0.105 confirms macro uptrend continuation
🔽 Bearish Scenario (Blue Down Arrow):
Rejection at wedge top → breakdown of $0.082 → revisit $0.073 support
Below $0.073 would invalidate short-term bullish structure
Disclaimer
The information and publications are not meant to be, and do not constitute, financial, investment, trading, or other types of advice or recommendations supplied or endorsed by TradingView. Read more in the Terms of Use.
Disclaimer
The information and publications are not meant to be, and do not constitute, financial, investment, trading, or other types of advice or recommendations supplied or endorsed by TradingView. Read more in the Terms of Use.