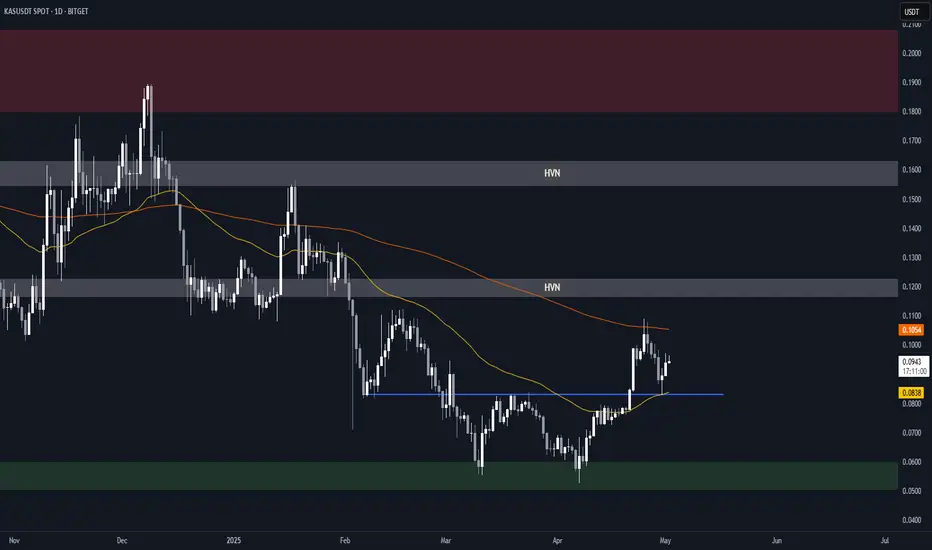
After retesting the $0.05 demand zone (previous resistance dating back to August 2023), 
 KASUSDT reclaimed the 50-day EMA (yellow) and tested the 200-day EMA (orange), before a brief pullback with the 50-day EMA acting as support.
Key Levels
• $0.050-$0.060: Main demand zone
• $0.083: Current support, reinforced by 50-day EMA
• $0.105: Current resistance, reinforced by 200-day EMA
• ~$0.120: HVN and potential resistance
• $0.155-$0.160: HVN, previous S/R and potential resistance
• $0.180-$0.200: Main supply zone
Here's a weekly chart with volume profiles for more context:

Considerations
• The breakout from the recent downtrend, and the break above the 50-day EMA followed by a retest as support, is a good sign for the bulls.
• If the 200-day EMA is successfully reclaimed, it could offer a good shot at retesting the main supply zone in the $0.180-$0.200 area.
• Conversely, a sustained break back below the 50-day EMA could lead to another test of the $0.050-$0.060 main demand zone.
Neutral outlook until a break above 200-day EMA or below 50-day EMA.
Key Levels
• $0.050-$0.060: Main demand zone
• $0.083: Current support, reinforced by 50-day EMA
• $0.105: Current resistance, reinforced by 200-day EMA
• ~$0.120: HVN and potential resistance
• $0.155-$0.160: HVN, previous S/R and potential resistance
• $0.180-$0.200: Main supply zone
Here's a weekly chart with volume profiles for more context:
Considerations
• The breakout from the recent downtrend, and the break above the 50-day EMA followed by a retest as support, is a good sign for the bulls.
• If the 200-day EMA is successfully reclaimed, it could offer a good shot at retesting the main supply zone in the $0.180-$0.200 area.
• Conversely, a sustained break back below the 50-day EMA could lead to another test of the $0.050-$0.060 main demand zone.
Neutral outlook until a break above 200-day EMA or below 50-day EMA.
Note
As expected, KASPA found resistance at the first HVN and failed to reclaim it before retracing to the previous $0.083 support.This would be a logical area for a bounce, with the confluence of previous support and 0.618 Fib of the last leg up.
A reversal here could open the way to a retest of both HVNs and of the main supply zone in the $0.180-$0.200 area.
Disclaimer
The information and publications are not meant to be, and do not constitute, financial, investment, trading, or other types of advice or recommendations supplied or endorsed by TradingView. Read more in the Terms of Use.
Disclaimer
The information and publications are not meant to be, and do not constitute, financial, investment, trading, or other types of advice or recommendations supplied or endorsed by TradingView. Read more in the Terms of Use.