KAVA price failed to break out during the weekend but is still trading inside a long-term bullish pattern.
The crypto market had a bullish performance last week. However, a short-term bearish reversal began near the end of the week and continued during the weekend.
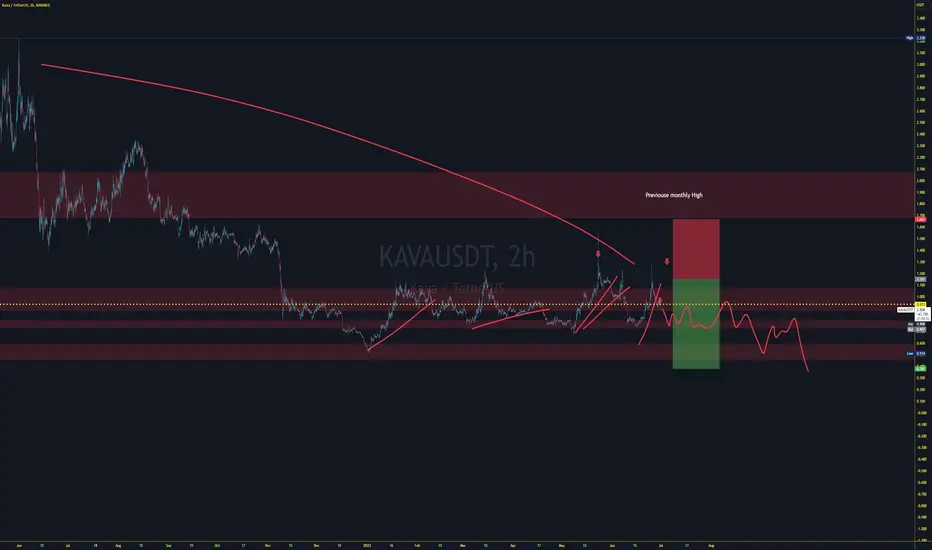
The KAVA price has increased alongside an ascending support line since the beginning of the year. More recently, it bounced at the line on June 15 and began a sharp rally.
While KAVA reached a high of $1.28 on June 25, it failed to close above the $1.15 horizontal resistance area. Rather, it created a long upper wick (red icon) and fell. These wicks are considered signs of selling pressure since buyers could not sustain the price increase.
Despite the drop, the $115 area and the ascending support line together create an ascending triangle. This is considered a bullish pattern. So, a breakout down from it is the most likely scenario.
strategy bearish
sell only
The crypto market had a bullish performance last week. However, a short-term bearish reversal began near the end of the week and continued during the weekend.
The KAVA price has increased alongside an ascending support line since the beginning of the year. More recently, it bounced at the line on June 15 and began a sharp rally.
While KAVA reached a high of $1.28 on June 25, it failed to close above the $1.15 horizontal resistance area. Rather, it created a long upper wick (red icon) and fell. These wicks are considered signs of selling pressure since buyers could not sustain the price increase.
Despite the drop, the $115 area and the ascending support line together create an ascending triangle. This is considered a bullish pattern. So, a breakout down from it is the most likely scenario.
strategy bearish
sell only
Note
According to our current Kava price prediction, the value of Kava is predicted to rise by 4.80% and reach $ 0.987884 by July 6, 2023. According to our technical indicators, the current sentiment is Bearish while the Fear & Greed Index is showing 59 (Greed). Kava recorded 15/30 (50%) green days with 11.47% price volatility over the last 30 days. Based on our Kava forecast, it's now a bad time to buy Kava.Comparing Kava against other important technological innovations and trends is one way of predicting where the Kava price could head over the long term. The table above shows what the Kava price would be by end of year 2024, 2025, and 2026 if its growth trajectory followed the growth of the internet, or large tech companies like Google and Facebook in their growth phase.
In the best case scenario, KAVA price prediction for year 2026 is $ 49.41 if it follows Facebook growth. In case Kava would follow Internet growth the prediction for 2026 would be $ 5.67.
Based on data from July 01, 2023 at 05:26, the general Kava price prediction sentiment is bearish , with 11 technical analysis indicators signaling bullish signals, and 16 signaling bearish signals.
KAVA price prediction was last updated on July 01, 2023 at 05:26.
Kava is currently trading below the 200-day simple moving average (SMA). The 200-day SMA has been signaling SELL for the last 4 days, since Jun 26, 2023.
The price of Kava is currently below the 50-day SMA and this indicator has been signaling SELL for the last 3 days, since Jun 27, 2023.
The most recent Death Cross in the Bitcoin market happened 412 days ago, on May 15, 2022. Meanwhile, a Golden Cross last occurred on May 01, 2022, which was 425 days ago.
Based on our technical indicators, Kava's 200-day SMA will rise in the next month and will hit $ 1.049127 by Jul 30, 2023. Kava's short-term 50-Day SMA is estimated to hit $ 0.865699 by Jul 30, 2023.
The Relative Strength Index (RSI) momentum oscillator is a popular indicator that signals whether a cryptocurrency is oversold (below 30) or overbought (above 70). Currently, the RSI value is at 50.34, which indicates that the KAVA market is in a neutral position.
Kava Key Price Levels
Based on today's classical pivot point (P1) with the value of $ 0.951288, Kava has support levels of $ 0.921329, $ 0.873532, and the strongest at $ 0.843574. Similarly, Kava resistance levels are at $ 0.999085, $ 1.029043, and $ 1.076840..
Disclaimer
The information and publications are not meant to be, and do not constitute, financial, investment, trading, or other types of advice or recommendations supplied or endorsed by TradingView. Read more in the Terms of Use.
Disclaimer
The information and publications are not meant to be, and do not constitute, financial, investment, trading, or other types of advice or recommendations supplied or endorsed by TradingView. Read more in the Terms of Use.