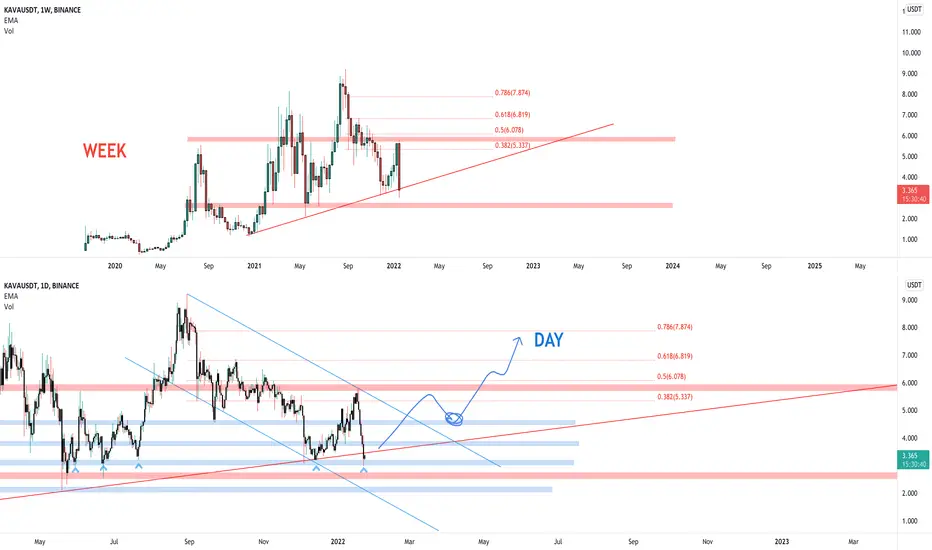
The price had a huge rejection from the weekly resistance on the 0.5 Fibonacci (0.6$) level as you can see from the upper chart.
At the moment the price is creating a huge Engulfing candle on the weekly timeframe, it includes the previous 5 bars (5 weeks).
About the support, the price is testing daily static support and dynamic weekly support. As for Long Position, the logic is the same even for the short scenario. We avoid opening a new short position above the weekly structures.
How to approach?
we are waiting for the weekly close and we will understand if the price is going to create a double bottom of 3.7$.
If the price is going to have a breakout from the descending channel and retest the daily resistance (around 5$) as new support, we can add to our watchlist and wait for applying our rules.
Remember, It's not enough a breakout, we need a strategy.
–––––
Follow the Shrimp 🦐
Keep in mind.
- 🟣 Purple structure -> Monthly structure.
- 🔴 Red structure -> Weekly structure.
- 🔵 Blue structure -> Daily structure.
- 🟡 Yellow structure -> 4h structure.
Note
The price is testing the daily support. We'd like to see a breakout from 3.8$ soon
Note
The price is starting to follow my drawing.Our strategies never triggered for the short position!
Disclaimer
The information and publications are not meant to be, and do not constitute, financial, investment, trading, or other types of advice or recommendations supplied or endorsed by TradingView. Read more in the Terms of Use.
Disclaimer
The information and publications are not meant to be, and do not constitute, financial, investment, trading, or other types of advice or recommendations supplied or endorsed by TradingView. Read more in the Terms of Use.