4H trend chart
-
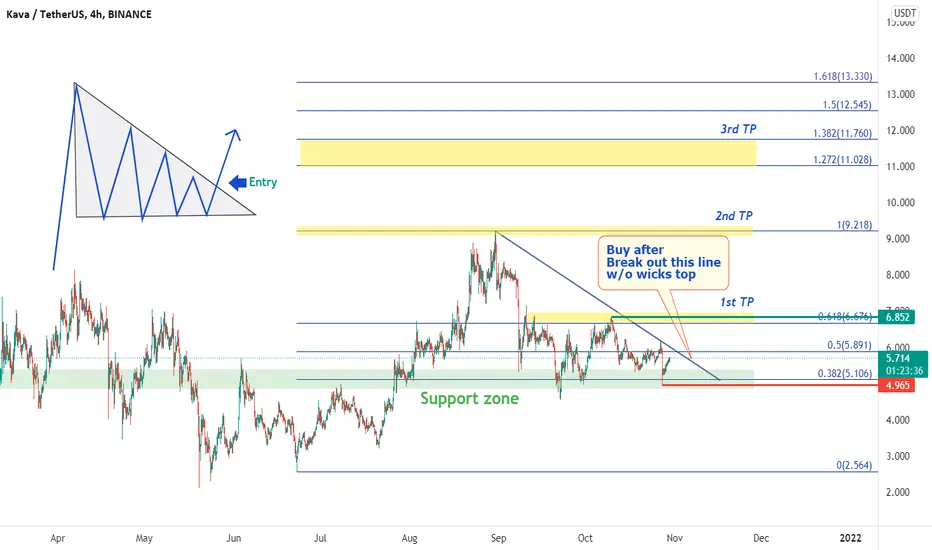
KAVA is consolidating as a triangle since 8/21
This triangle is formed with a downtrend line and support zone.
If price can break out the downtrend line, trading strategy as below.
-
Profit Targets:
a) 6.852----Green horizontal ray
b) 9.218----Fib(1)
c) 11.028~11.760----Fib(1.272~1.382)
Stop losses:
a) 4.9658-----Red horizontal ray
-
If you like this analysis, smash the "like button" and leave a comment below to share your thoughts
or let me know what crypto you want to see!
Trading is a reflection of yourself. Learn more daily and be ready for every opportunity.
Have a nice trading!
🌔Signal channel: t.me/tradingdiary_cat
🌕Discussion group: t.me/rextalkcrypto
✨Bybit sign up: bybit.com/register?affiliate_id=12787&group_id=36093&group_type=1
💡Sign up through link
→Join Teaching Group for free!(PM me)
🌕Discussion group: t.me/rextalkcrypto
✨Bybit sign up: bybit.com/register?affiliate_id=12787&group_id=36093&group_type=1
💡Sign up through link
→Join Teaching Group for free!(PM me)
Disclaimer
The information and publications are not meant to be, and do not constitute, financial, investment, trading, or other types of advice or recommendations supplied or endorsed by TradingView. Read more in the Terms of Use.