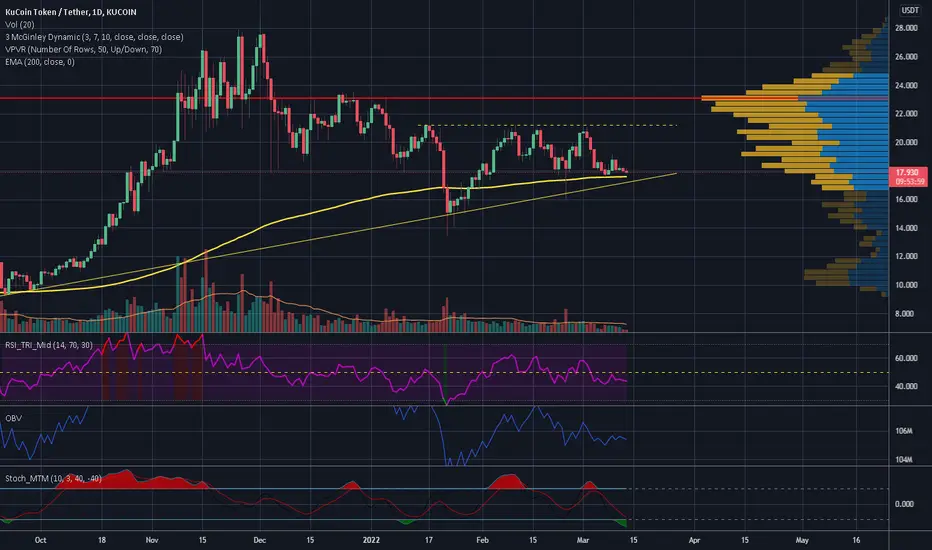
KCS has been hitting a resistance since 16th of January but with time EMA 200 rose and price it's now enclosed between that and the resistance at 21.192 USDT. From a chart pattern point ov view this appears like a rising asymetrical triangle and even the fact that volume is decreaseing could be in line with a possible upcoming breakup which is a very good bullish pattern but overall indicators are uncertain.
I think you could start DCA if price hit lower support and bounce back OVER EMA 200, and despite this you should use a stop loss anyway considering the current market situation. Right now I wouldn't give anything for accounted.
If instead it breaks downwards you might look for shorting opportunities (I'll post some updates if I can).
Our number one rule now must be not risking anything and avoid to remain trapped with some bags (trust me I speak by personal experience).
Good luck
I do TA because I like and it seems at least 70% of my calls usually turn out to be true. If you wanna support me please donate some tradingview coin or check "about me"
Disclaimer
The information and publications are not meant to be, and do not constitute, financial, investment, trading, or other types of advice or recommendations supplied or endorsed by TradingView. Read more in the Terms of Use.