On the above 5-day chart price action has corrected 96% since the sell signal (not shown). Now is a good opportunity to go long. Why?
1) A strong buy signal prints. (not shown).
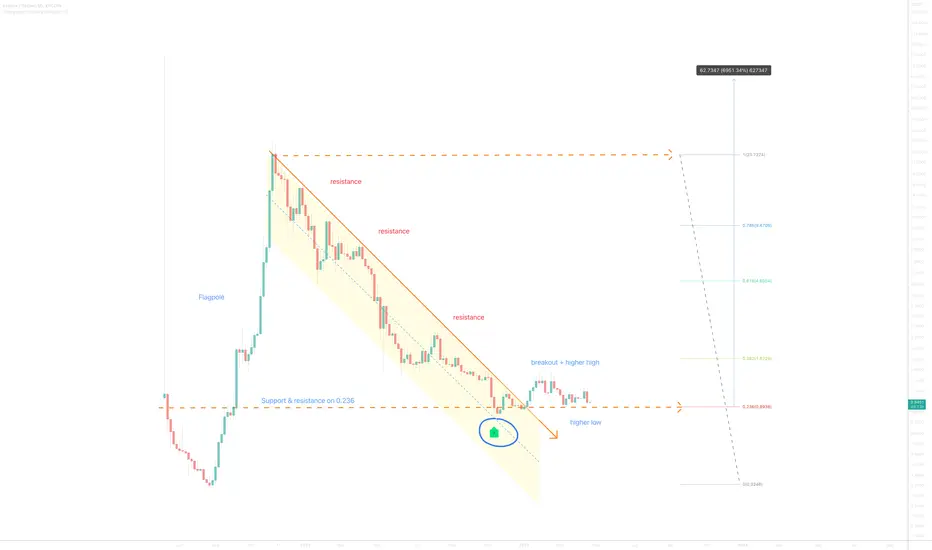
2) Price action resistance breakout (USD and BTC pairs).
3) Strong positive divergence between price action and multiple oscillators. This divergence occurs over an 80 day period.
4) Price action finds multiple weeks of support on the Fibonacci 0.236, since the start of the year.
Is it possible price action could fall further? Sure.
Is it probable? No.
Ww
Type: trade
Risk: <= 6%
Timeframe: Don’t know.
Return: 60x
1) A strong buy signal prints. (not shown).
2) Price action resistance breakout (USD and BTC pairs).
3) Strong positive divergence between price action and multiple oscillators. This divergence occurs over an 80 day period.
4) Price action finds multiple weeks of support on the Fibonacci 0.236, since the start of the year.
Is it possible price action could fall further? Sure.
Is it probable? No.
Ww
Type: trade
Risk: <= 6%
Timeframe: Don’t know.
Return: 60x
Trade active
Dear Ps, this is a very active long position.Note
Stochastic RSI up 20, Look left.Trade active
Nothing has really changed from the published idea, look for a cycle top around $50-60Note
See a print at or above 2.10? Then it off to $8 rather quickly.BTC
bc1q2eckdzh0q8vsd7swcc8et6ze7s99khhxyl7zwy
Weblink: patreon.com/withoutworries
Allow 3-6 months on ideas. Not investment advice. DYOR
bc1q2eckdzh0q8vsd7swcc8et6ze7s99khhxyl7zwy
Weblink: patreon.com/withoutworries
Allow 3-6 months on ideas. Not investment advice. DYOR
Disclaimer
The information and publications are not meant to be, and do not constitute, financial, investment, trading, or other types of advice or recommendations supplied or endorsed by TradingView. Read more in the Terms of Use.
BTC
bc1q2eckdzh0q8vsd7swcc8et6ze7s99khhxyl7zwy
Weblink: patreon.com/withoutworries
Allow 3-6 months on ideas. Not investment advice. DYOR
bc1q2eckdzh0q8vsd7swcc8et6ze7s99khhxyl7zwy
Weblink: patreon.com/withoutworries
Allow 3-6 months on ideas. Not investment advice. DYOR
Disclaimer
The information and publications are not meant to be, and do not constitute, financial, investment, trading, or other types of advice or recommendations supplied or endorsed by TradingView. Read more in the Terms of Use.