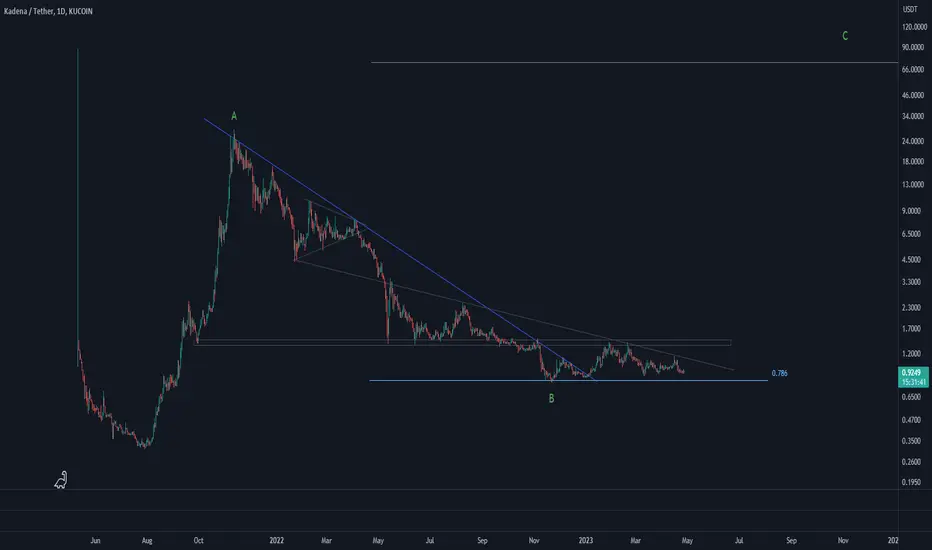
Kadena once became so popular that its price exploded upward. After that, not surprisingly, KDA entered a corrective wave, a long one. It seems the corrective wave have rested at 0.786 Fibonacci level and is consolidating in a rectangle shaped pattern. Also, an A-B-C pattern might unfold; if true and C=A, this means price sharp upward move could be experienced again. Let's see what happens.
Note
So KDA downtrend is unfolding in a descending channel. First, we have to see price break this channel upward.
Note
It seems KDA's correction is finished. Let's see if KDA can break the downtrend channel upward.
Note
Finally, KDA broke the downtrend channel.
Note
KDA, right on time.
Note
So, KDA went up well and wave 1 ended. It seems, correction wave 2 might be unfolding in an inverted wedge pattern. Keep in mind that wave count is for illustration and wave count or wave formation probably going to change as more candles forms. Overall, KDA chart looks promising. Let's see what happens.
Note
So, as it turned out, KDA was making a harmonic pattern, not an inverted wedge. It seems the harmonic pattern is finished, and KDA is going to break the right leg's downtrend line. If successful, an upward wave could start. Let's see what happens.
Note
VIP Telegram channel: t.me/saeedcrypto_publicTrade active
So, KDA broke the downtrend line and is going up toward the major horizontal resistance area. Let's see what happens.
Disclaimer
The information and publications are not meant to be, and do not constitute, financial, investment, trading, or other types of advice or recommendations supplied or endorsed by TradingView. Read more in the Terms of Use.
Disclaimer
The information and publications are not meant to be, and do not constitute, financial, investment, trading, or other types of advice or recommendations supplied or endorsed by TradingView. Read more in the Terms of Use.