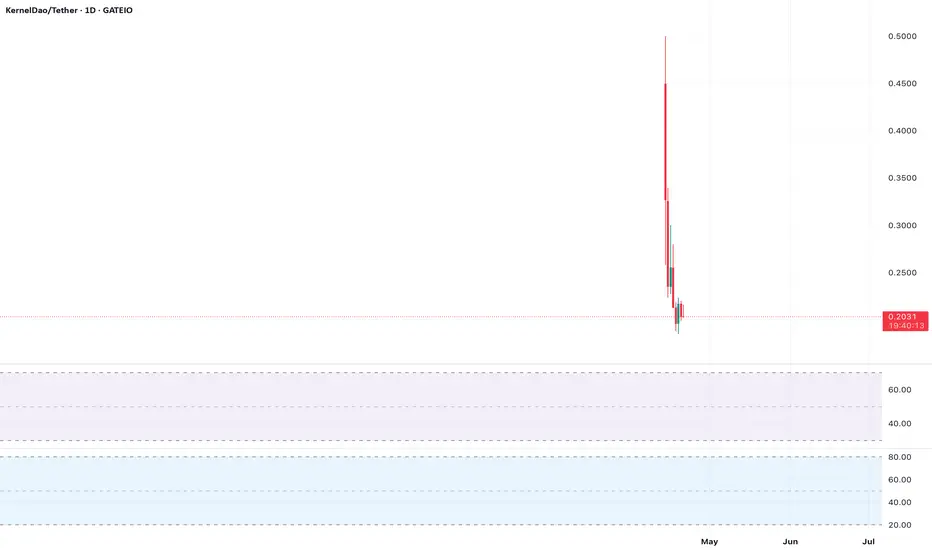
$KERNEL is currently trading at $0.1948, down 8.16% in the last 24 hours, and showing signs of consolidation near a key support zone around $0.1844-$0.20. On the 4H chart, the price is forming a symmetrical triangle, with lower highs and higher lows, suggesting indecision. The RSI (14) is hovering near 30, indicating oversold conditions, which could signal a potential bounce if buyers step in. However, the MACD shows bearish momentum with a recent crossover below the signal line, aligning with fading volume on rallies. Key resistance lies at $0.30-$0.35, where previous distribution phases capped upside. For bulls, a break above $0.22 with strong volume could target $0.26. Bears should watch for a breakdown below $0.1844, which may push prices toward $0.15. Always use tight stops in this volatile market and avoid overleveraging. This is not financial advice—DYOR and trade responsibly
Disclaimer
The information and publications are not meant to be, and do not constitute, financial, investment, trading, or other types of advice or recommendations supplied or endorsed by TradingView. Read more in the Terms of Use.
Disclaimer
The information and publications are not meant to be, and do not constitute, financial, investment, trading, or other types of advice or recommendations supplied or endorsed by TradingView. Read more in the Terms of Use.