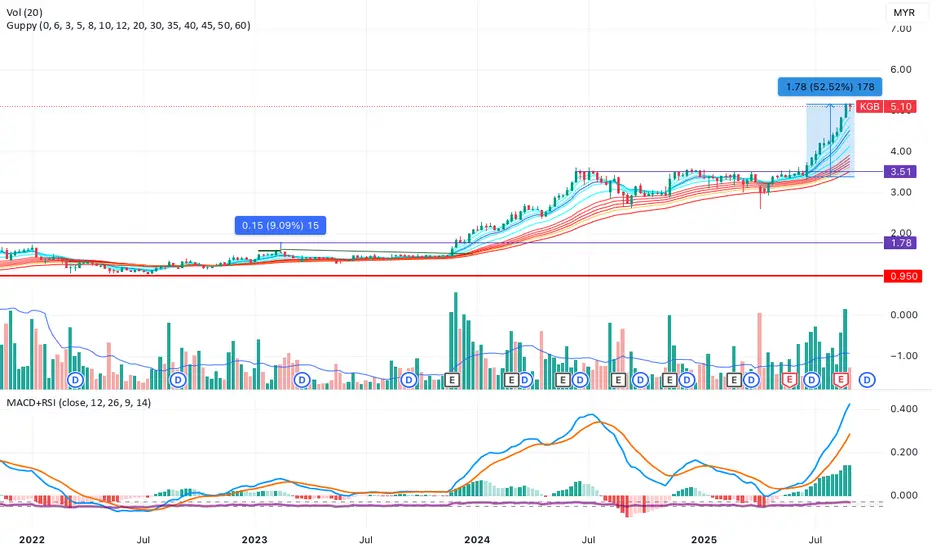
In the weekly chart, KGB formed a volume contraction pattern (VCP) from 10.6.2024.
The resistance was formed around 3.51.
On 11.11.2024, there was a large green candle with large volume and the following day, another green candle with large volume ensued. But this did not break the resistance.
The MACD also showed a golden cross.
Price consolidated along the resistance line until 30.12.2024, then started to dip by 20% on 7.4.2025. It formed a red hammer but the volume was large and broke the long standing support of this stock. Holders would have cut their positions but this was effectively a spring (wtf?)
Price than steadily climbed back towards the 3.51 resistance, before breaking out on the week of 23.6.2025. Mind you, it was due for a dividend ex-date on 10.7.2025. So I will be put off by this fact.
By then, the stock marked up further until its current price of 5.10 without any significant pullbacks. Thats around 52.5% from the opening candle during the week of its breakout.
Impression:
Buying and holding at the resistance, anticipating a VCP breakout does not usually work in our favour. The ideal situation is to wait for a breakout. But in this case, in the weekly chart at least, the stock didnt give the opportunity to buy by pulling back. But I'm going to have a look at the daily chart next for any realistic opportunities.
Disclaimer
The information and publications are not meant to be, and do not constitute, financial, investment, trading, or other types of advice or recommendations supplied or endorsed by TradingView. Read more in the Terms of Use.
Disclaimer
The information and publications are not meant to be, and do not constitute, financial, investment, trading, or other types of advice or recommendations supplied or endorsed by TradingView. Read more in the Terms of Use.