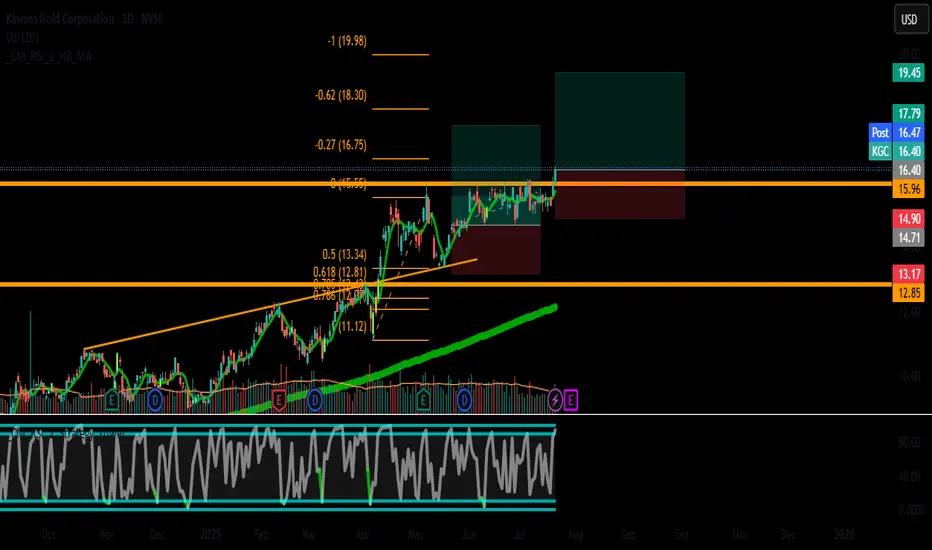
🚀 Trade Idea: KGC (Kinross Gold Corporation) – Bullish Breakout Play
Entry: $16.40 | Stop Loss: $14.90 | Take Profit: $19.45
Risk/Reward Ratio: ~1:2.5
📈 Technical Setup
Trend:
Daily: Strong uptrend (higher highs & higher lows).
4H/1H: Bullish momentum confirmed with SMA(20) > SMA(50).
Key Levels:
Support: $15.90 (recent swing low) / $14.90 (strong demand zone).
Resistance: $16.50 (recent high) → Breakout target: $19.45 (2024 YTD resistance).
Indicators:
RSI(14): 62 (bullish, no overbought signal).
MACD: Positive crossover on daily chart.
Volume: Rising on upward moves (bullish confirmation).
💡 Why KGC?
✅ Fundamentals:
Strong revenue growth (Q2 earnings beat).
Undervalued P/E (~16x vs. industry avg. ~20x).
Low debt (Score 10 in debt analysis).
✅ Catalysts:
Gold price stabilizing above $2,400/oz (sector tailwind).
Upcoming Fed rate cuts could boost gold miners.
🎯 Trade Execution
Entry: $16.40 (break of consolidation).
Stop Loss: $14.90 (below key support, ~9% risk).
Take Profit: $19.45 (20% upside, near YTD highs).
Partial Profit-Taking: Consider scaling out at $17.80 (mid-term resistance).
⚠️ Risk Management
Position size ≤ 2-3% of portfolio.
Adjust SL to breakeven if price reaches $17.00.
🔍 Watch For:
Gold price volatility (Fed speeches, CPI data).
Earnings date (next report: Aug 2025).
📌 Comments? Would you take this trade? Let’s discuss below! 👇
#Gold #MiningStocks #Breakout #KGC #TradingView
(Disclaimer: Not financial advice. Do your own research.)
Disclaimer
The information and publications are not meant to be, and do not constitute, financial, investment, trading, or other types of advice or recommendations supplied or endorsed by TradingView. Read more in the Terms of Use.
Disclaimer
The information and publications are not meant to be, and do not constitute, financial, investment, trading, or other types of advice or recommendations supplied or endorsed by TradingView. Read more in the Terms of Use.