This chart forms part of a larger research note and should not be considered financial advice.
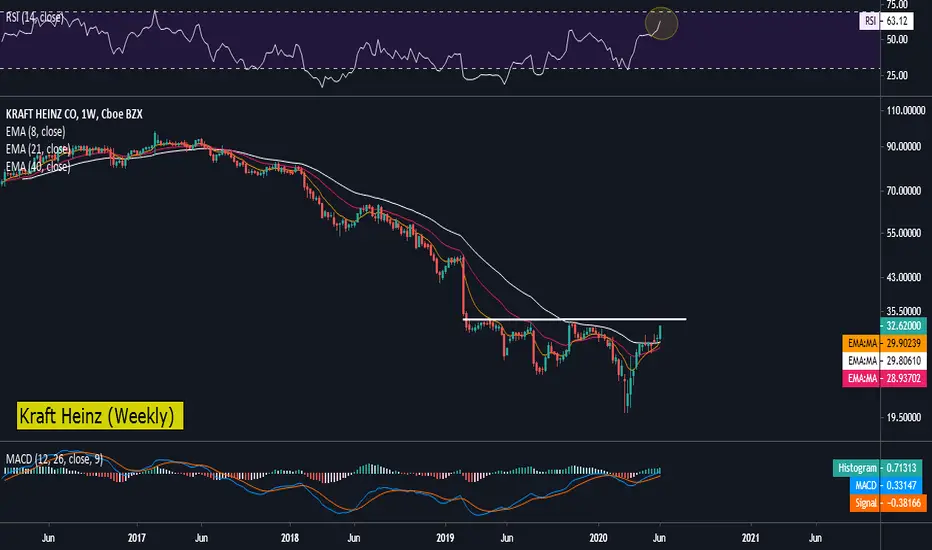
Kraft Heinz | Weekly Chart | For the first time in three years, the share has made a strong close above it’s 40-week moving average (i.e. 200-day moving average). A weekly close above $34.30 – the 16-month resistance level opens the share for further upside. Adding to the bullish structure is the RSI which prints a 3 1/2 year high.
Kraft Heinz | Weekly Chart | For the first time in three years, the share has made a strong close above it’s 40-week moving average (i.e. 200-day moving average). A weekly close above $34.30 – the 16-month resistance level opens the share for further upside. Adding to the bullish structure is the RSI which prints a 3 1/2 year high.
Disclaimer
The information and publications are not meant to be, and do not constitute, financial, investment, trading, or other types of advice or recommendations supplied or endorsed by TradingView. Read more in the Terms of Use.
Disclaimer
The information and publications are not meant to be, and do not constitute, financial, investment, trading, or other types of advice or recommendations supplied or endorsed by TradingView. Read more in the Terms of Use.