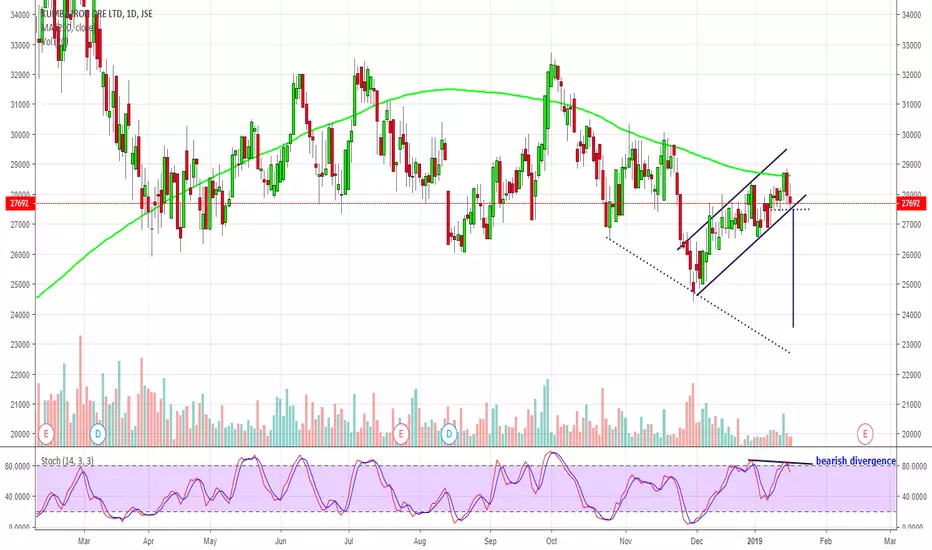
Kumba has been trading below it's 200 day moving average for the last 4 months and we have noticed most of the shorter term moving averages trending down and trading below this 200 day. This is evidence of a bearish trend and should see the stock move lower over time. We have recently tested the 200 day ma @ 286 and seen a quick rejection in price. We are trading in a bearish channel and will be looking for a close below the R275 support level to confirm the break down. Also interesting to note is that the Stochastic indicator is showing bearish divergence with the indicator having made a lower high, even though price made a higher high on the daily. Target of this move should then be R235.
Note
Just a note here that we never saw the daily close below R275 to confirm the trade on this one, so this was never taken.. Luckily, as this was close to the low before a massive rally"If you do what you love, you'll never work a day in your life" - Marc Anthony
Disclaimer
The information and publications are not meant to be, and do not constitute, financial, investment, trading, or other types of advice or recommendations supplied or endorsed by TradingView. Read more in the Terms of Use.
"If you do what you love, you'll never work a day in your life" - Marc Anthony
Disclaimer
The information and publications are not meant to be, and do not constitute, financial, investment, trading, or other types of advice or recommendations supplied or endorsed by TradingView. Read more in the Terms of Use.