Long
KLAYUSDT
Hello Crypto Lovers,
Mars Signals team wishes you high profits.
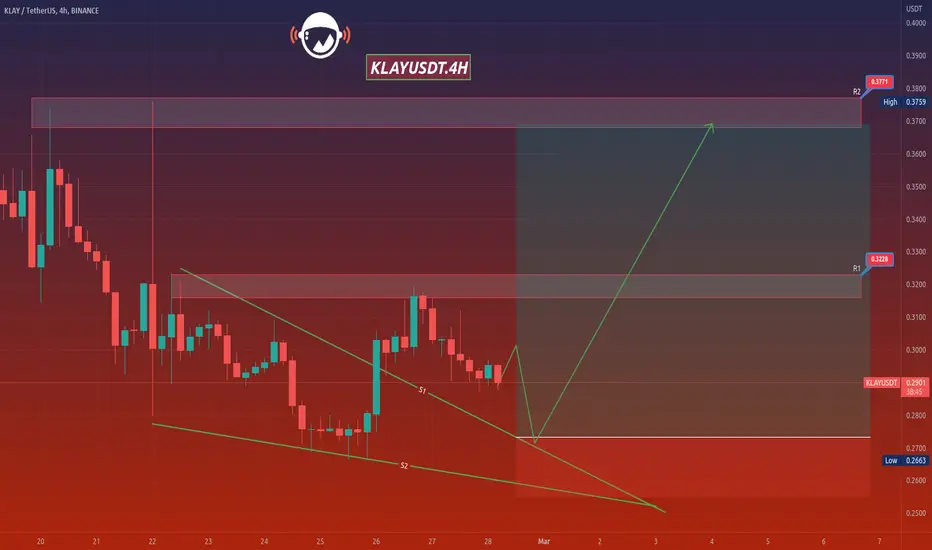
This is a 4-hour-time frame analysis for KLAYUSDT
R2 and R1 are the resistance areas in this chart with their representation of the disability of the price to rise at several points. S1 used to be a resistance line in the past. And S2 is a support line clearly that contains the support of price at various points. Therefore, the price had a kind of falling trend and it is reaching S1 after a little rise at the current point. By having its fall continued to touch S1, we will have a rise expected for it to reach higher amounts. Subsequently, we must wait for some confirmation candles to rise and an increase would be there for the price to reach R1 or by having more fixation over there, more rise is expected then. Also by giving us some falling signs at any points or through moving below S1, more decline is definitely will be waiting for the price toward lower amounts. Note that S1 and S2 are risky areas in order to put your trade orders. For enjoying less risky trades, we recommend you to obtain every piece of information and details through our analyses and updates.
Warning: This is just a suggestion and we do not guarantee profits. We advise you to analyze the chart before opening any positions.
Wish you luck
Mars Signals team wishes you high profits.
This is a 4-hour-time frame analysis for KLAYUSDT
R2 and R1 are the resistance areas in this chart with their representation of the disability of the price to rise at several points. S1 used to be a resistance line in the past. And S2 is a support line clearly that contains the support of price at various points. Therefore, the price had a kind of falling trend and it is reaching S1 after a little rise at the current point. By having its fall continued to touch S1, we will have a rise expected for it to reach higher amounts. Subsequently, we must wait for some confirmation candles to rise and an increase would be there for the price to reach R1 or by having more fixation over there, more rise is expected then. Also by giving us some falling signs at any points or through moving below S1, more decline is definitely will be waiting for the price toward lower amounts. Note that S1 and S2 are risky areas in order to put your trade orders. For enjoying less risky trades, we recommend you to obtain every piece of information and details through our analyses and updates.
Warning: This is just a suggestion and we do not guarantee profits. We advise you to analyze the chart before opening any positions.
Wish you luck
Disclaimer
The information and publications are not meant to be, and do not constitute, financial, investment, trading, or other types of advice or recommendations supplied or endorsed by TradingView. Read more in the Terms of Use.
Disclaimer
The information and publications are not meant to be, and do not constitute, financial, investment, trading, or other types of advice or recommendations supplied or endorsed by TradingView. Read more in the Terms of Use.