Long
Komodo (KMD) to $1.40
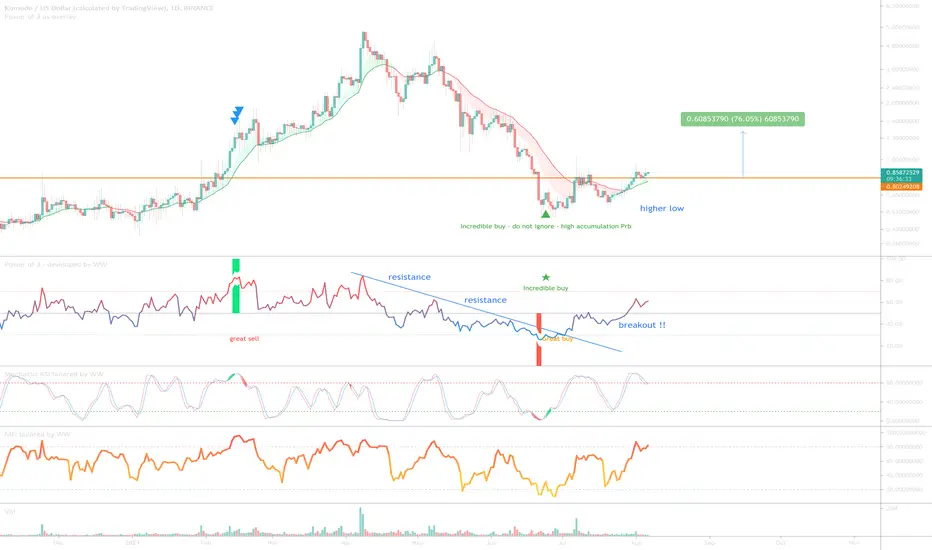
On the above 1-day chart price action has corrected 90%. A ‘incredible buy’ opportunity now exists. Why bullish?
1) Price action breaks out of resistance and prints a higher low.
2) RSI resistance breaks out.
3) Price action makes an impulsive move to the upper side of the Bollinger Band (not shown here to keep the chart clean).
4) The KMD / Bitcoin chart prints a fractal of the dollar chart as well as a 2nd ‘incredible buy’ opportunity.
Is it possible price action falls further? For sure?
Is it probable? Very unlikely.
1st target $1.40 / 75% gain.
Good luck!
WW
1-day KMD / Bitcoin chart:
BTC
bc1q2eckdzh0q8vsd7swcc8et6ze7s99khhxyl7zwy
Weblink: patreon.com/withoutworries
Allow 3-6 months on ideas. Not investment advice. DYOR
bc1q2eckdzh0q8vsd7swcc8et6ze7s99khhxyl7zwy
Weblink: patreon.com/withoutworries
Allow 3-6 months on ideas. Not investment advice. DYOR
Disclaimer
The information and publications are not meant to be, and do not constitute, financial, investment, trading, or other types of advice or recommendations supplied or endorsed by TradingView. Read more in the Terms of Use.