Bullish on KMI 30...!!!!
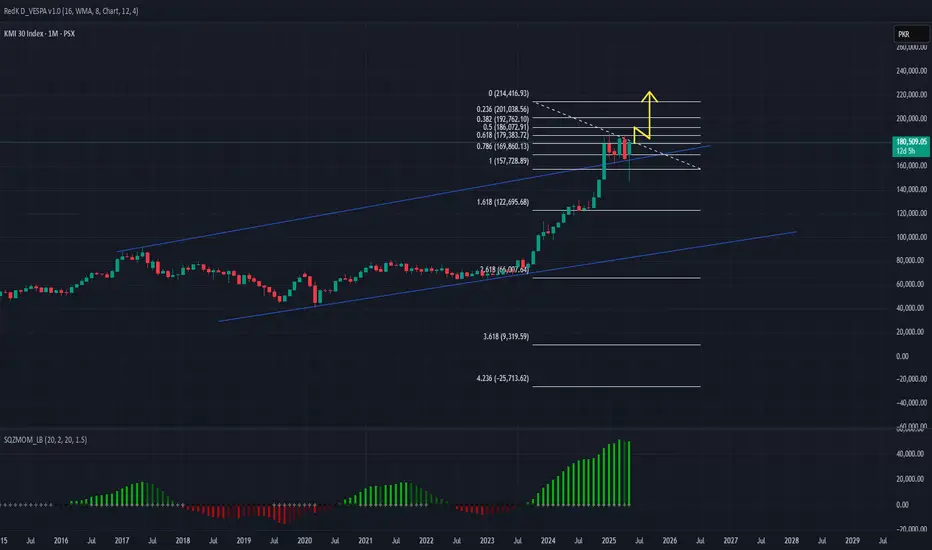
Technical Analysis: The KMI 30 is currently in a bullish zone, as per current monthly chart suggesting potential upward movement towards the 186,107 and then 192,250
Technical Analysis: The KMI 30 is currently in a bullish zone, as per current monthly chart suggesting potential upward movement towards the 186,107 and then 192,250
Disclaimer
The information and publications are not meant to be, and do not constitute, financial, investment, trading, or other types of advice or recommendations supplied or endorsed by TradingView. Read more in the Terms of Use.
Disclaimer
The information and publications are not meant to be, and do not constitute, financial, investment, trading, or other types of advice or recommendations supplied or endorsed by TradingView. Read more in the Terms of Use.