Candlestick Patterns :
Bollinger Bands :
Trend Analysis :
Possible Scenarios :
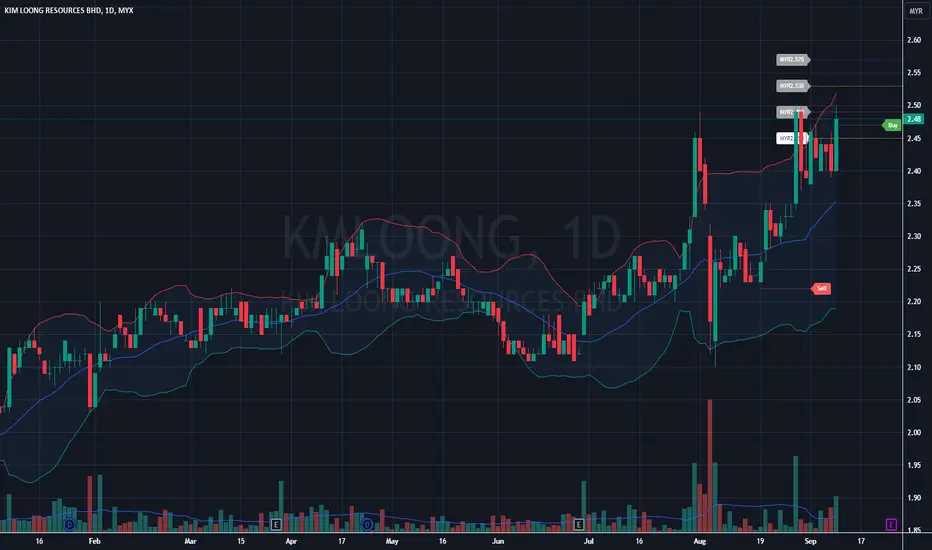
- The price hit a high of MYR2.50 and closed at MYR2.48 (+3.33%) on the daily timeframe.
Bollinger Bands :
- The price is currently near the upper band, suggesting potential overbought conditions. However, since the price is continuing to rise, it could signal a strong bullish trend if the price remains close to the upper band.
Trend Analysis :
- The overall trend seems bullish as the price is making higher highs and higher lows. It’s supported by the price staying above the moving average.
- A continuation of the uptrend would depend on the price breaking through the MYR2.50 level.
Possible Scenarios :
- Bullish Case: If the price breaks above MYR2.50, the next potential targets would be the next psychological round numbers, such as MYR2.60 or higher.
- Bearish Case: If the price fails to break the MYR2.50 resistance and falls below the moving average (around MYR2.25), it could signal a shift in momentum toward a correction or consolidation phase.
➀➁➂➃➄
Disclaimer
The information and publications are not meant to be, and do not constitute, financial, investment, trading, or other types of advice or recommendations supplied or endorsed by TradingView. Read more in the Terms of Use.
➀➁➂➃➄
Disclaimer
The information and publications are not meant to be, and do not constitute, financial, investment, trading, or other types of advice or recommendations supplied or endorsed by TradingView. Read more in the Terms of Use.