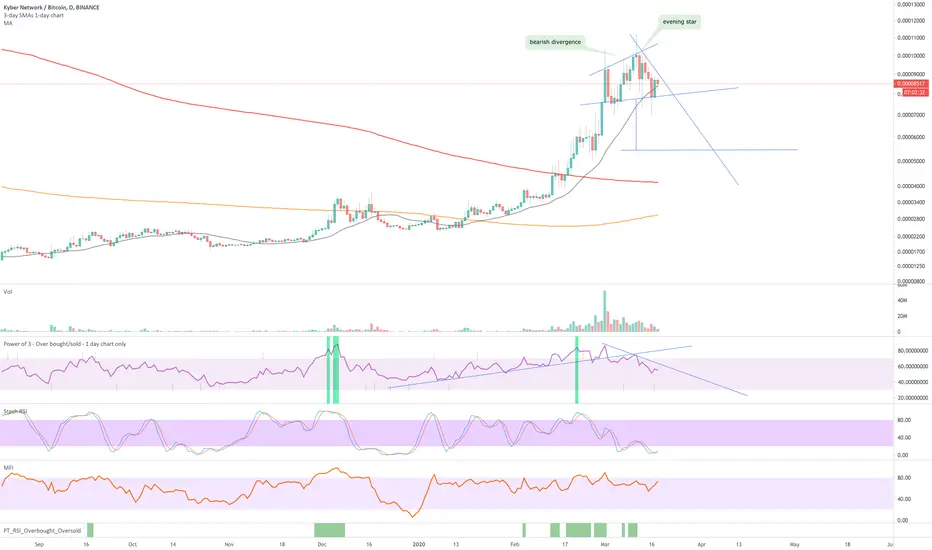
Bearish divergence observed between price action and RSI on 1-day chart. 3-day chart below show's us a loss of RSI support.
4500 sats is my target
3-day chart:

4500 sats is my target
3-day chart:
Note
Progressing very nicely. At least another 20% drop ahead.Note
1-day chart with two moving averages, 150 & 600-day, effectively the 50 & 200-day moving averages on the 3-day chart. There's a 3-day life cross approaching around mid-May. I recommend you do not keep this 'short' position open by that time. When this life cross occurs, price action will very likely moon.Trade closed: target reached
BTC
bc1q2eckdzh0q8vsd7swcc8et6ze7s99khhxyl7zwy
Weblink: patreon.com/withoutworries
Allow 3-6 months on ideas. Not investment advice. DYOR
bc1q2eckdzh0q8vsd7swcc8et6ze7s99khhxyl7zwy
Weblink: patreon.com/withoutworries
Allow 3-6 months on ideas. Not investment advice. DYOR
Disclaimer
The information and publications are not meant to be, and do not constitute, financial, investment, trading, or other types of advice or recommendations supplied or endorsed by TradingView. Read more in the Terms of Use.