Current Scenario:
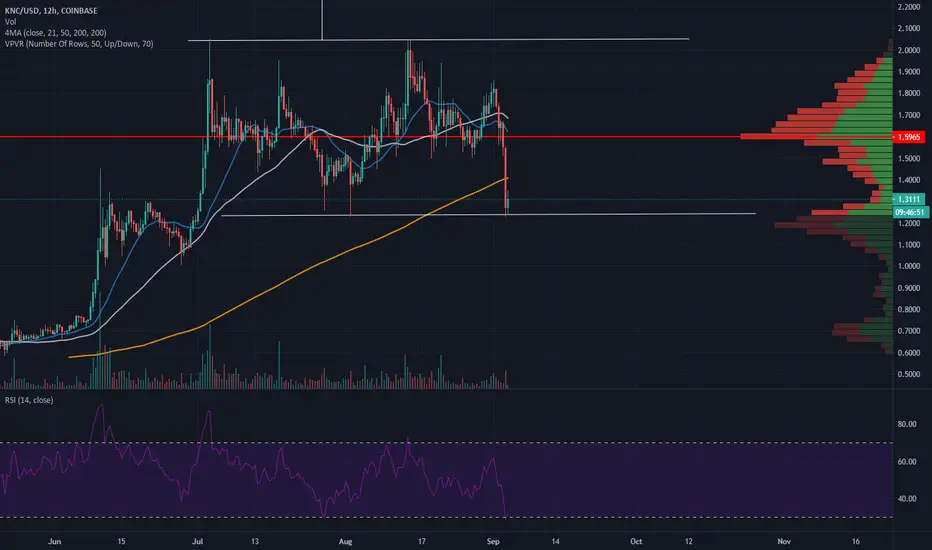
1. Market structure: price action is currently in a rectangle pattern, which is a neutral pattern so it can go either way. The weekly 21 moving average is currently at 1.19 USD, which is about right underneath the bottom trend line right now, which should confirm that the bottom trend line can temporarily serve as support.
2. Volume: there is no clear trend on the past 3 days' downward price action candles, especially with the volume on the candle close yesterday 9/3 increasing from the day before.
3. RSI: on all major timeframes are either at about 50 or lower, which signals a reversal could come.
The Bullish Case:
1. Price action has to at least get a solid close above the 12HR 200 moving average, currently at 1.41, in order to convince that we are reversing towards the top trend line .
2. On the weekly chart, a convincing signal that the pattern can break upwards will be either if this week's candle closes green OR at least with a longer wick than the 7/20 weekly candle. This will signal that we are getting more buyers at the bottom trend line .
The Bearish Case:
1. In my observation, BTC price action affects most altcoins. If BTC continues to drop , I would predict more downward action.
2. The price action breaches the weekly 21MA and close this week below it.
Note
*These are purely my speculations and are not financial advice.Disclaimer
The information and publications are not meant to be, and do not constitute, financial, investment, trading, or other types of advice or recommendations supplied or endorsed by TradingView. Read more in the Terms of Use.
Disclaimer
The information and publications are not meant to be, and do not constitute, financial, investment, trading, or other types of advice or recommendations supplied or endorsed by TradingView. Read more in the Terms of Use.