The bearish case:
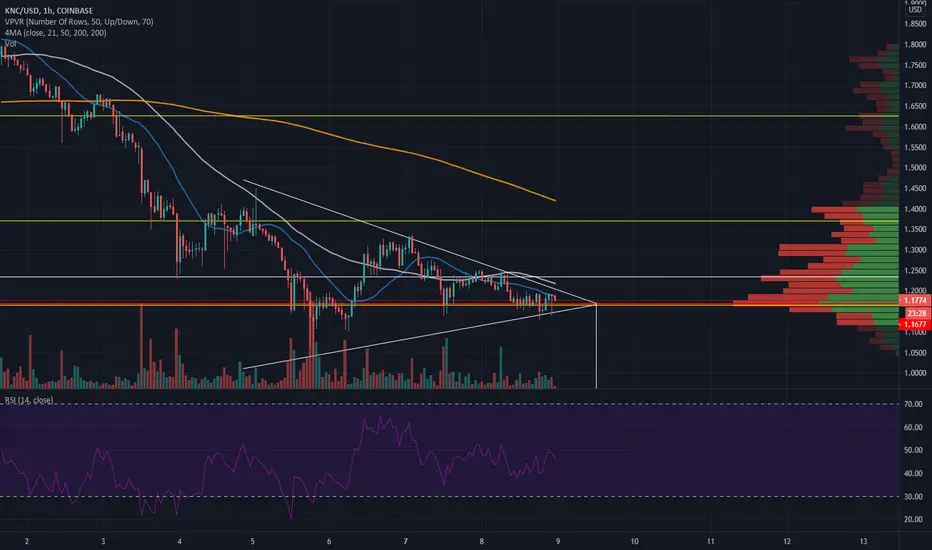
1. Price action is currently in a symmetrical triangle pattern, which continues in the direction it started at 60% so more downward action is expected by chance. Currently, the price action has not bounced off the 21 weekly moving average, which is at about 1.2 right now. The measured move of the breakdown is about 0.75USD.
2. Bitcoin dominance is currently at 60.77%, which is right under the 21 daily moving average. If the daily candle closes above the daily moving average, that is also a bearish indicator for KNC and altcoins in general.
The bullish case:
1. On the 4HR chart, it is clear that we are seeing more buyer volume comparing to sellers so that could be a sign that buyers can come in for a break out of this pattern.
2. There is bullish divergence on the daily chart. If this plays out and the price action gets back above the weekly 21 moving average then we can expect more upward price action.
Note
*These are purely my speculations and are not financial advice.Disclaimer
The information and publications are not meant to be, and do not constitute, financial, investment, trading, or other types of advice or recommendations supplied or endorsed by TradingView. Read more in the Terms of Use.
Disclaimer
The information and publications are not meant to be, and do not constitute, financial, investment, trading, or other types of advice or recommendations supplied or endorsed by TradingView. Read more in the Terms of Use.