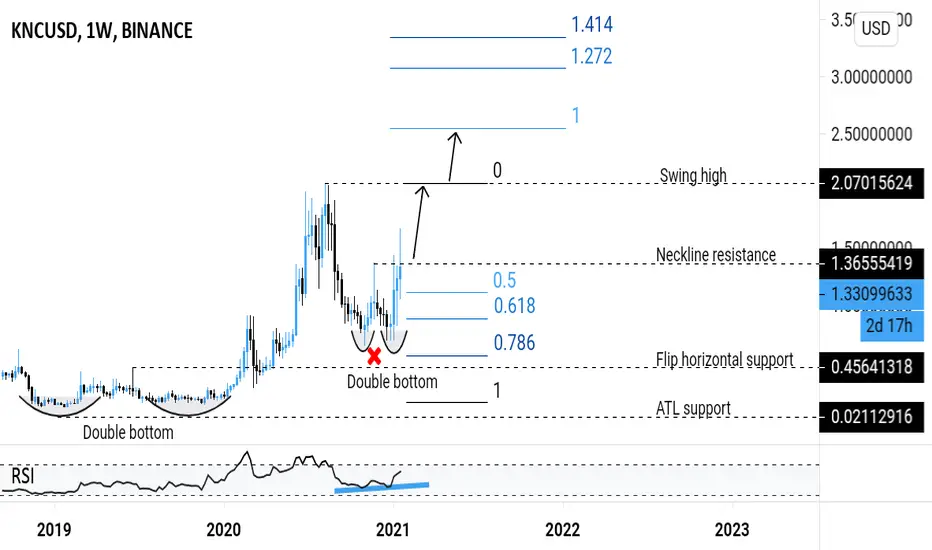
ANALYSIS 🔎
- KNCUSD retested the flip horizontal support and 0.618 fibonacci retracement level.
- Price action printed the double bottom trend reversal pattern.
- Price brokeout above the double bottom neckline resistance.
- This is a bullish signal.
- RSI printed a bullish divergence signal.
TARGETS 🎯
- Swing high
- Fibonacci extension levels
Disclaimer
The information and publications are not meant to be, and do not constitute, financial, investment, trading, or other types of advice or recommendations supplied or endorsed by TradingView. Read more in the Terms of Use.
Disclaimer
The information and publications are not meant to be, and do not constitute, financial, investment, trading, or other types of advice or recommendations supplied or endorsed by TradingView. Read more in the Terms of Use.