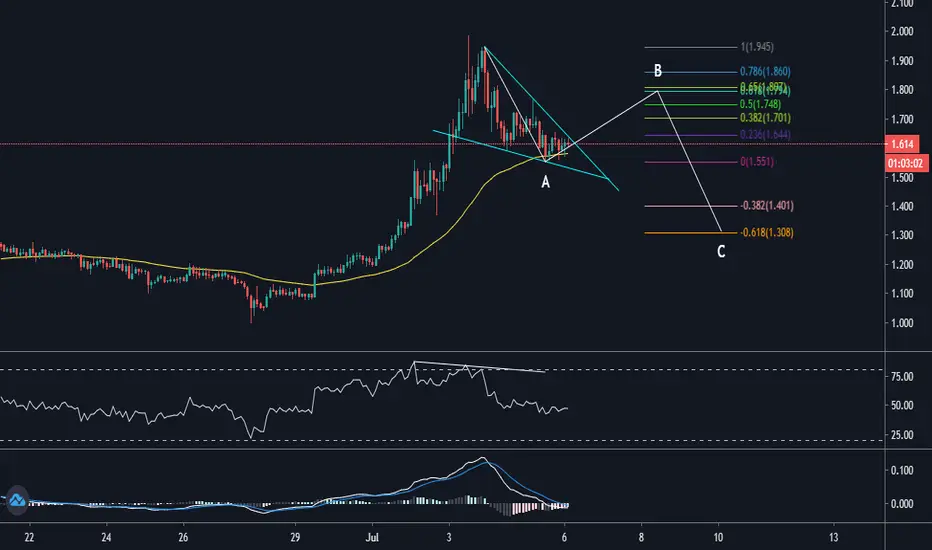
On the 2 hours chart, the price is trending slightly above the 55 EMA which acts as a strong dynamic support (yellow). Beside that the price is now forming a strong bullish falling wedges. This is however could be the action to complete ABC zig zag correction structure. I will only catch the B wave which align with the golden pocket zone as well before shorting the C wave. Just like usual, open long position when the price breaks out of the upper line of the falling wedges.
Disclaimer
The information and publications are not meant to be, and do not constitute, financial, investment, trading, or other types of advice or recommendations supplied or endorsed by TradingView. Read more in the Terms of Use.
Disclaimer
The information and publications are not meant to be, and do not constitute, financial, investment, trading, or other types of advice or recommendations supplied or endorsed by TradingView. Read more in the Terms of Use.