KOREBTC inverse Head&Shoulders
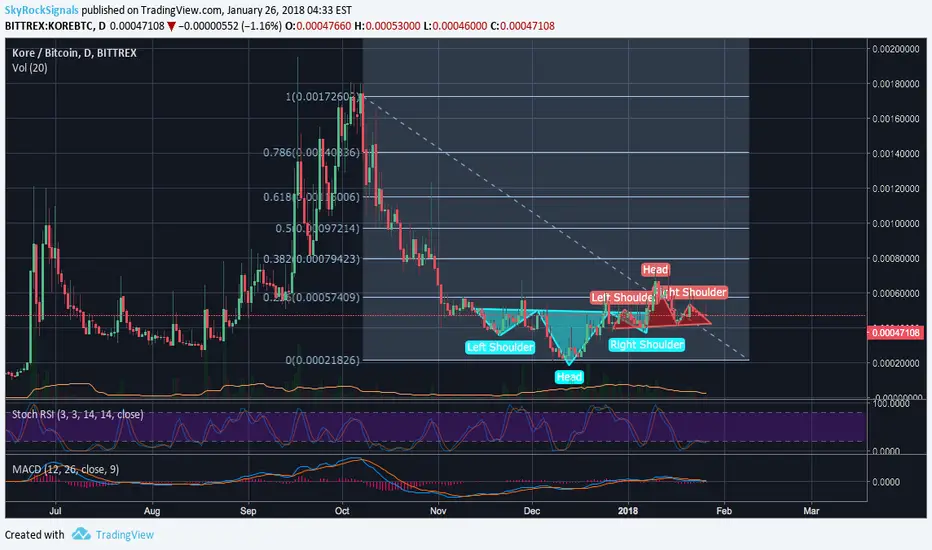
An inverse Head&Shoulders on a day chart is followed by another H&S pattern. The price is below Fib 0.236 Resistance level, while RSI indicates oversold zone. So there could be 2 scenarios: it either will go down to the support line near the 0.000218 or will grow further and in case of breaking throw 0.000574 level will grow to the targets mentioned in our signal. However, on the 30 minutes chart the TA is optimistic, we recommend to wait and carefully track this coin till it goes above the resistance and consolidates there.
Claim up to 600 USDT in welcome rewards & compete for a share of 5,000 USDT in BitMart Futures Contest!
➡ Register & Claim Bonus: bitmart.com/invite/VShg8M
➡ Join Contest: bitmart.com/futures-competition/Skyrexio/en-US
➡ Register & Claim Bonus: bitmart.com/invite/VShg8M
➡ Join Contest: bitmart.com/futures-competition/Skyrexio/en-US
Disclaimer
The information and publications are not meant to be, and do not constitute, financial, investment, trading, or other types of advice or recommendations supplied or endorsed by TradingView. Read more in the Terms of Use.