My previous chart on kotak mahindra bank is a little off, so i thought i'll make a fresh one.
Bullish Signals
-Kautilya.K
Bullish Signals
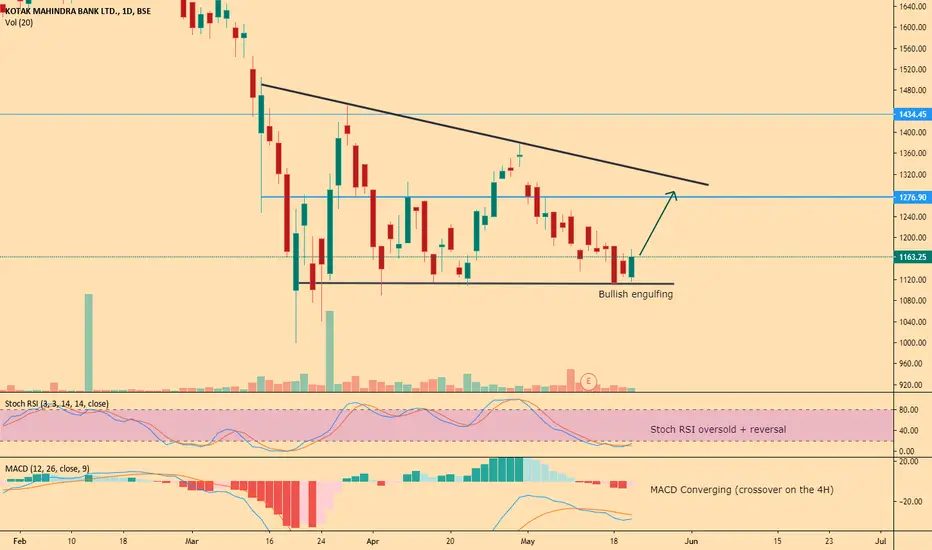
- The daily candle formed a bullish engulfing candle.
- The Stochastic RSI is oversold and is attempting a reversal.
- The MACD on the Daily is converging and had a bullish crossover on the 4H.
- This is currently a sideways market, Bollinger bands are useful for determining a reversal. The price action just hit the lower band and reversal with the above mentioned signals.
-Kautilya.K
Note
Strength declining, might retest support againNote
Trade active
Trade closed: target reached
Related publications
Disclaimer
The information and publications are not meant to be, and do not constitute, financial, investment, trading, or other types of advice or recommendations supplied or endorsed by TradingView. Read more in the Terms of Use.
Related publications
Disclaimer
The information and publications are not meant to be, and do not constitute, financial, investment, trading, or other types of advice or recommendations supplied or endorsed by TradingView. Read more in the Terms of Use.