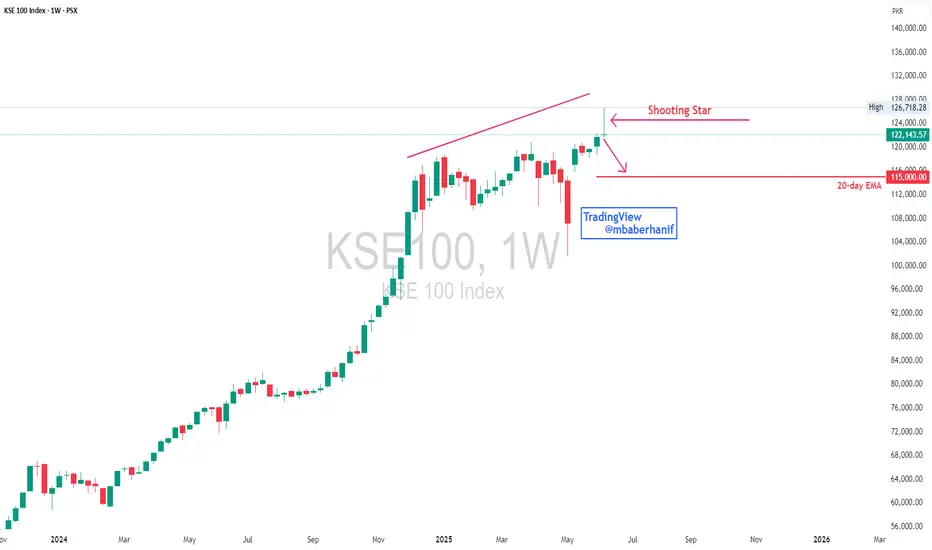
The KSE-100 index weekly chart shows a strong uptrend that has recently started to face some signs of exhaustion. After a sustained bullish rally, the index is encountering resistance near the 126,700 level, forming a Shooting Star candlestick — a bearish reversal signal — indicating potential selling pressure at the top. Additionally, there's a clear volume decline during the recent uptrend, suggesting weakening momentum and possible buyer fatigue. The key short-term support lies near 115,000, aligned with the 20-week EMA. A break below this level may trigger further downside correction. Overall, while the longer-term trend remains bullish, caution is advised as bearish reversal signals are emerging; a corrective phase may unfold if support levels fail to hold.
Disclaimer
The information and publications are not meant to be, and do not constitute, financial, investment, trading, or other types of advice or recommendations supplied or endorsed by TradingView. Read more in the Terms of Use.
Disclaimer
The information and publications are not meant to be, and do not constitute, financial, investment, trading, or other types of advice or recommendations supplied or endorsed by TradingView. Read more in the Terms of Use.