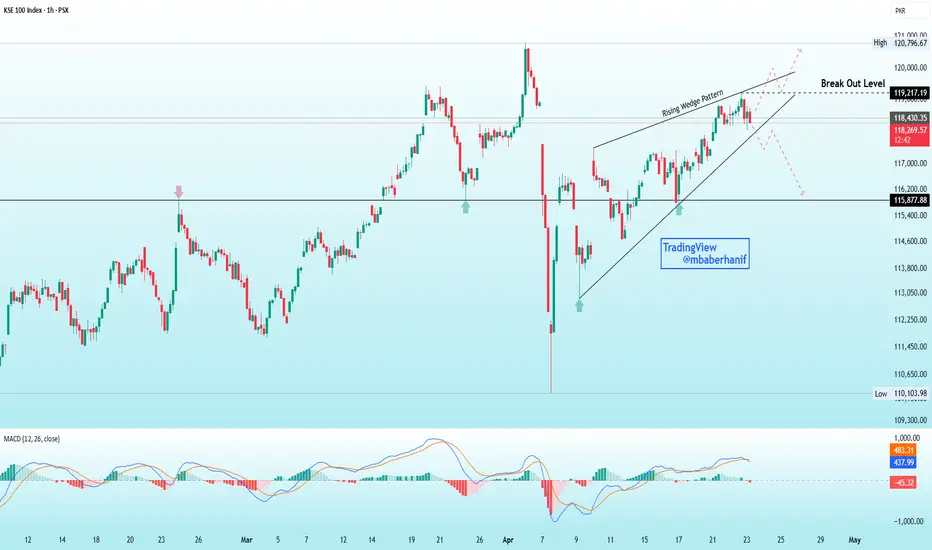
The chart displays the KSE-100 Index on a 1-hour timeframe, showing a rising wedge pattern—a typically bearish formation suggesting a potential reversal or breakdown. The index is currently trading near the wedge’s upper boundary and just below the marked "Break Out Level" at 119,217.19. If the price breaks above this level with strong momentum, it may continue towards the 120,000 zone. However, a rejection at the resistance line could trigger a decline, with the first key support around 115,877.88. The MACD indicator below the chart shows waning bullish momentum as the histogram trends toward the zero line and the MACD line (blue) is close to crossing below the signal line (orange), reinforcing the bearish bias. Overall, the index appears to be at a critical juncture, and traders should watch for a confirmed breakout or breakdown to determine the next significant move.
Disclaimer
The information and publications are not meant to be, and do not constitute, financial, investment, trading, or other types of advice or recommendations supplied or endorsed by TradingView. Read more in the Terms of Use.
Disclaimer
The information and publications are not meant to be, and do not constitute, financial, investment, trading, or other types of advice or recommendations supplied or endorsed by TradingView. Read more in the Terms of Use.