KSE-100 Index posted huge gains of 24% in just 6 weeks. Afterwards correction comes in. This downward movement corrects up to 10%.
At this juncture we are faced with the question What next.
To find the answer we dig in to the past behavior of the KSE-100.
Our dive yields three instances from the past.
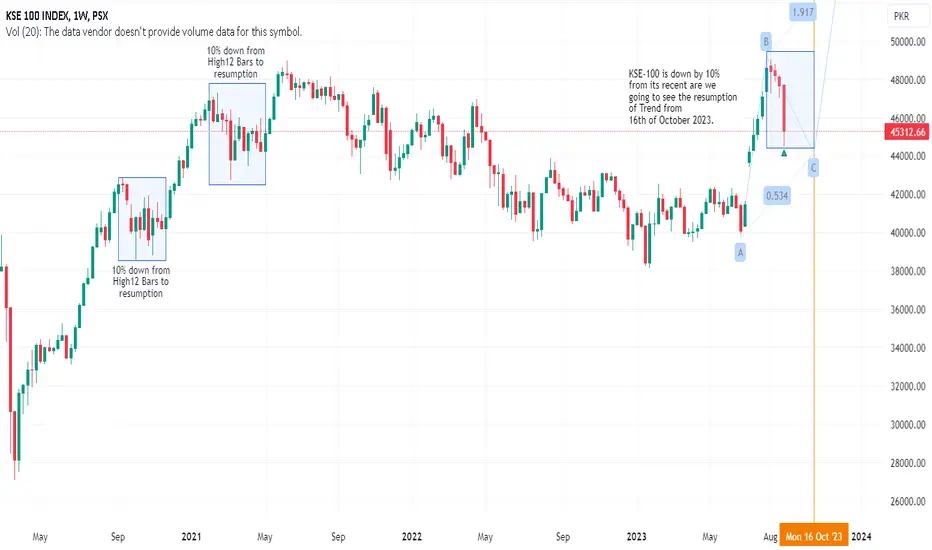
1. 23rd January 2017 to 17th April 2017 KSE-100 loses 9.51% in 13 weeks before it resumes the trend.
2. From 7th Sept 2020 the KSE-100 loses 10% of its value in 12 weeks to resume its journey to north.
3. From 1st Feb. 2021 to 3rd May 2021 KSE-100 loses 10% again and in 12 weeks too.
This brings us to he probability that if the same pattern is repeated the resumption of trend can begin from or around 16th of October 2023.
This notion can further be augmented if the return of Mian Nawaz Sharif, as speculated, coincides.
If the History repeats itself the target for the next move shall be 54175.
At this juncture we are faced with the question What next.
To find the answer we dig in to the past behavior of the KSE-100.
Our dive yields three instances from the past.
1. 23rd January 2017 to 17th April 2017 KSE-100 loses 9.51% in 13 weeks before it resumes the trend.
2. From 7th Sept 2020 the KSE-100 loses 10% of its value in 12 weeks to resume its journey to north.
3. From 1st Feb. 2021 to 3rd May 2021 KSE-100 loses 10% again and in 12 weeks too.
This brings us to he probability that if the same pattern is repeated the resumption of trend can begin from or around 16th of October 2023.
This notion can further be augmented if the return of Mian Nawaz Sharif, as speculated, coincides.
If the History repeats itself the target for the next move shall be 54175.
Disclaimer
The information and publications are not meant to be, and do not constitute, financial, investment, trading, or other types of advice or recommendations supplied or endorsed by TradingView. Read more in the Terms of Use.
Disclaimer
The information and publications are not meant to be, and do not constitute, financial, investment, trading, or other types of advice or recommendations supplied or endorsed by TradingView. Read more in the Terms of Use.