📈
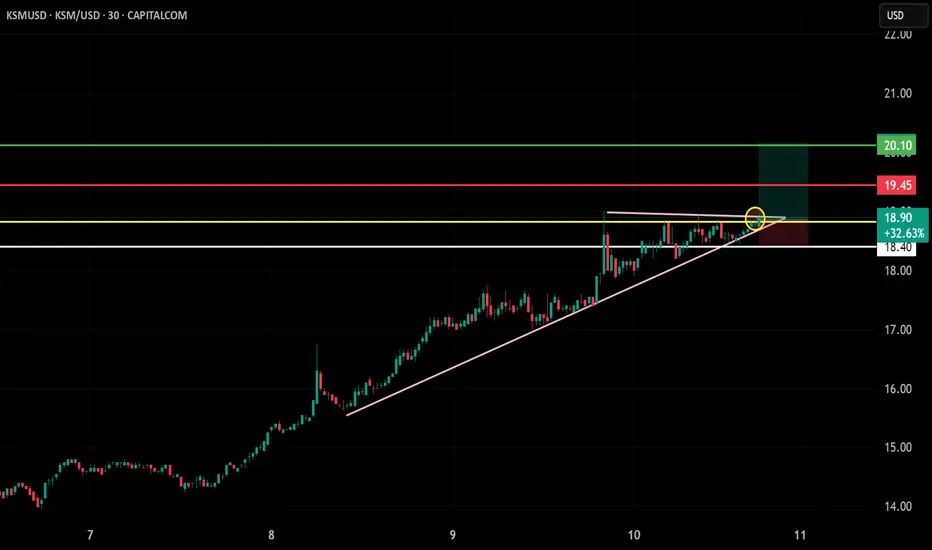
🔹 Asset: Kusama (KSM/USD)
🔹 Timeframe: 30-Minute Chart
🔹 Setup Type: Ascending Triangle Breakout (Bullish Continuation)
📌 Trade Plan (Long Position)
✅ Entry Zone: Around $18.90 (Breakout level above resistance)
✅ Stop-Loss (SL): Below $18.40 (Invalidation and trendline break)
🎯 Take Profit Targets
📌 TP1: $19.45 – Previous resistance zone
📌 TP2: $20.10 – Measured move and next supply level
📊 Risk-Reward Calculation
📉 Risk: $18.90 - $18.40 = $0.50
📈 Reward to TP1: $19.45 - $18.90 = $0.55 → R/R = 1:1.1
📈 Reward to TP2: $20.10 - $18.90 = $1.20 → R/R = 1:2.4 ✅
🔍 Technical Highlights
📌 Strong bullish trend with ascending triangle formation
📌 Tight consolidation below resistance shows accumulation
📌 Breakout with volume confirms bullish intent
📌 Trendline support intact, breakout above horizontal resistance
📈 Execution Strategy
📊 Enter near $18.90 after breakout candle closes
📉 Place SL below $18.40 to stay protected
💰 TP1 at $19.45, let rest ride toward $20.10
🚨 Invalidation Risk
❌ Breakdown below $18.40 negates setup
❌ Weak breakout = reassess entry
🚀 Final Take
✔ Clean bullish continuation pattern
✔ Great R:R ratio with trend momentum
✔ Stay patient and let the breakout confirm!
Disclaimer
The information and publications are not meant to be, and do not constitute, financial, investment, trading, or other types of advice or recommendations supplied or endorsed by TradingView. Read more in the Terms of Use.
Disclaimer
The information and publications are not meant to be, and do not constitute, financial, investment, trading, or other types of advice or recommendations supplied or endorsed by TradingView. Read more in the Terms of Use.