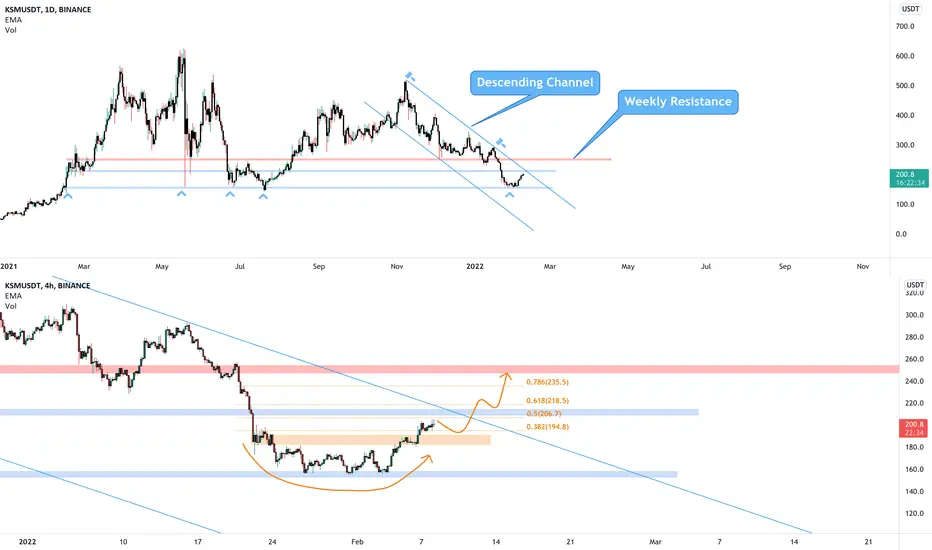
The market created a round bottom exactly on our support around 158$.
As you can see on the upper chart, the price bounced several times in that area, which means that this support is very strong.
On 4h timeframe, we can see a round bottom and a breakout from the 4h resistance, and now the price is testing the 0.5 Fibonacci level on the 206$
How to approach?
The price needs to have another breakout from the descending channel and retest the daily resistance as new support. IF the price is going to satisfy our rules, we could see a retest of the weekly resistance around 255$
–––––
Follow the Shrimp 🦐
Keep in mind.
- 🟣 Purple structure -> Monthly structure.
- 🔴 Red structure -> Weekly structure.
- 🔵 Blue structure -> Daily structure.
- 🟡 Yellow structure -> 4h structure.
Disclaimer
The information and publications are not meant to be, and do not constitute, financial, investment, trading, or other types of advice or recommendations supplied or endorsed by TradingView. Read more in the Terms of Use.
Disclaimer
The information and publications are not meant to be, and do not constitute, financial, investment, trading, or other types of advice or recommendations supplied or endorsed by TradingView. Read more in the Terms of Use.