$KTOS descending triangle #bullish #breakout on daily #chart
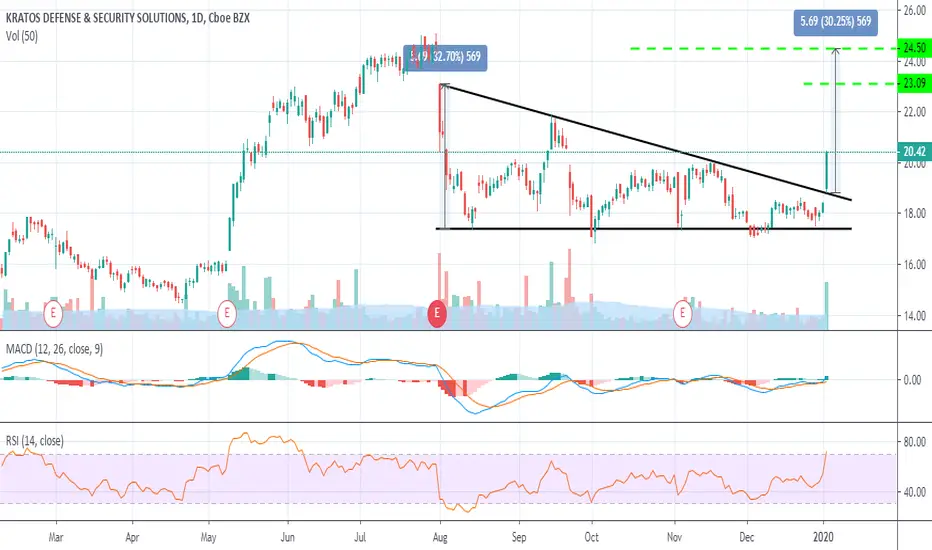
Since then the stock has been trading inside a beautiful descending triangle, until last week when it broke out on the back of the middle east tensions(we are talking about a security and defense stock after all)
Notice the big volume on the breakout and also the indicators MACD and RSI both supportive of further move up
Targets are :
T1 - intermediary top of the ascending triangle at 23.09
T2 - the measured move from the breakout of the triangle at 24.50
Good luck,
TA
Trade closed: stop reached
Stoped out Company couldn't even benefit from the amount of gear required to handle the riots
TA
Disclaimer
The information and publications are not meant to be, and do not constitute, financial, investment, trading, or other types of advice or recommendations supplied or endorsed by TradingView. Read more in the Terms of Use.
Disclaimer
The information and publications are not meant to be, and do not constitute, financial, investment, trading, or other types of advice or recommendations supplied or endorsed by TradingView. Read more in the Terms of Use.