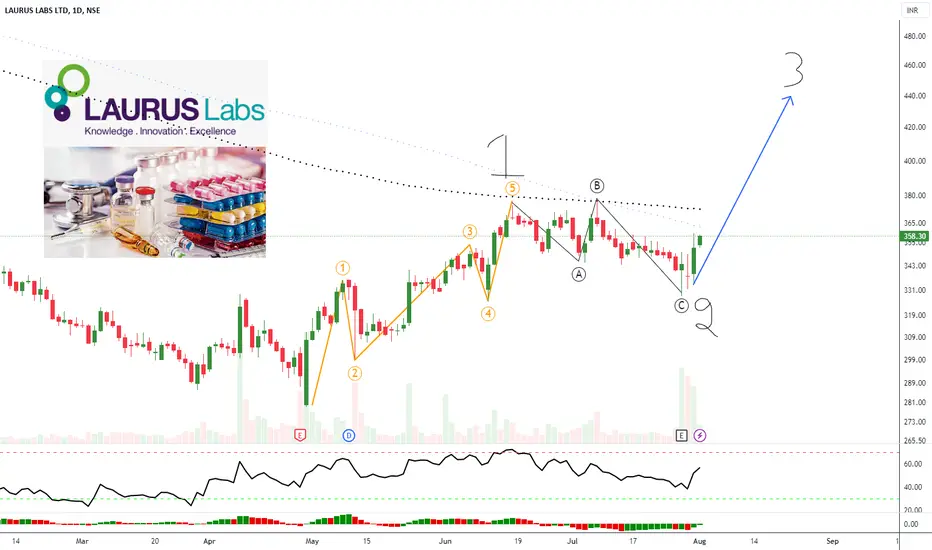
Laurslabs share plot elliot wave analysis .this stock complete 5 wave upside . 5 wave = 1 wave of impulse big time frame . price start downside 2 wave big time frame . 2 wave internal wave a,b,c complete down side . price again go upside wave 3
Disclaimer
The information and publications are not meant to be, and do not constitute, financial, investment, trading, or other types of advice or recommendations supplied or endorsed by TradingView. Read more in the Terms of Use.
Disclaimer
The information and publications are not meant to be, and do not constitute, financial, investment, trading, or other types of advice or recommendations supplied or endorsed by TradingView. Read more in the Terms of Use.