LDOUSDT Daily Chart Analysis | Strong Momentum Building
🔍 Let’s dive into the LDO/USDT perpetual contract and analyze the latest price action, highlighting a powerful bullish setup and key technical signals on the daily chart.
⏳ Daily Overview
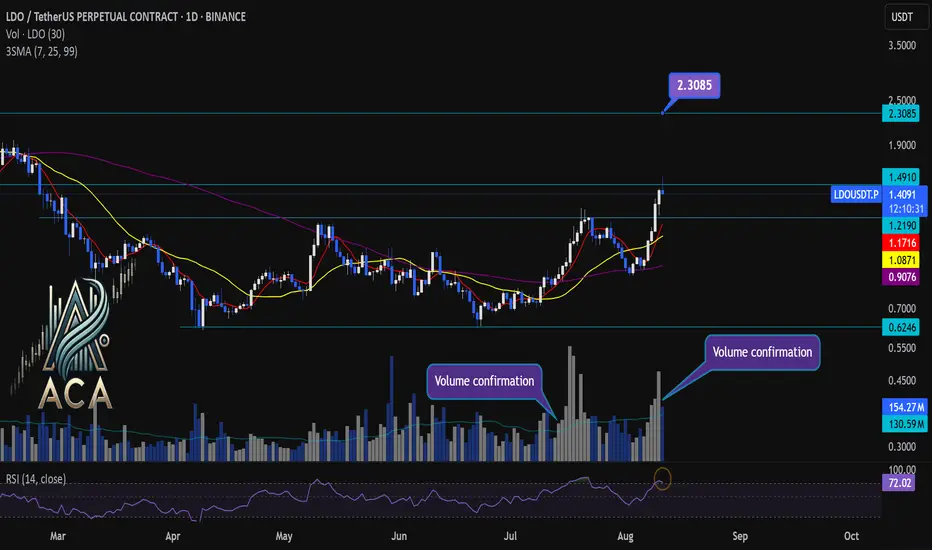
The daily chart reveals a strong surge in momentum as the price breaks out of its recent range, accompanied by a decisive uptick in trading volume. The 3SMA setup (short-term, mid-term, and long-term moving averages) is aligning bullishly, marking the beginning of a strong uptrend.
📊 Key Highlights:
- RSI (14) is entering the overbought zone (currently at 73.39), reflecting surging buyer demand and intensifying momentum.
- Price has broken out of the range box with elevated volume, confirming the move.
- Multiple volume confirmation spikes signal conviction behind the breakout.
- Immediate resistance is being challenged; the next key target to watch is $2.3085.
- For continued upside, we must see a daily candle close with solid volume above the current resistance level.
🚨 Conclusion:
Momentum is clearly accelerating on LDOUSDT, supported by volume and moving average bullish alignment. If price closes above resistance with strong volume, a continued rally toward the $2.3085 target is likely. Keep an eye on RSI levels and volume for further confirmations as this trend builds!
🔍 Let’s dive into the LDO/USDT perpetual contract and analyze the latest price action, highlighting a powerful bullish setup and key technical signals on the daily chart.
⏳ Daily Overview
The daily chart reveals a strong surge in momentum as the price breaks out of its recent range, accompanied by a decisive uptick in trading volume. The 3SMA setup (short-term, mid-term, and long-term moving averages) is aligning bullishly, marking the beginning of a strong uptrend.
📊 Key Highlights:
- RSI (14) is entering the overbought zone (currently at 73.39), reflecting surging buyer demand and intensifying momentum.
- Price has broken out of the range box with elevated volume, confirming the move.
- Multiple volume confirmation spikes signal conviction behind the breakout.
- Immediate resistance is being challenged; the next key target to watch is $2.3085.
- For continued upside, we must see a daily candle close with solid volume above the current resistance level.
🚨 Conclusion:
Momentum is clearly accelerating on LDOUSDT, supported by volume and moving average bullish alignment. If price closes above resistance with strong volume, a continued rally toward the $2.3085 target is likely. Keep an eye on RSI levels and volume for further confirmations as this trend builds!
Disclaimer
The information and publications are not meant to be, and do not constitute, financial, investment, trading, or other types of advice or recommendations supplied or endorsed by TradingView. Read more in the Terms of Use.
Disclaimer
The information and publications are not meant to be, and do not constitute, financial, investment, trading, or other types of advice or recommendations supplied or endorsed by TradingView. Read more in the Terms of Use.