From our previous post "LDO - Just Hit A Bottom" we can see that LDO has respected that bottom and given us more bullish confirmations.
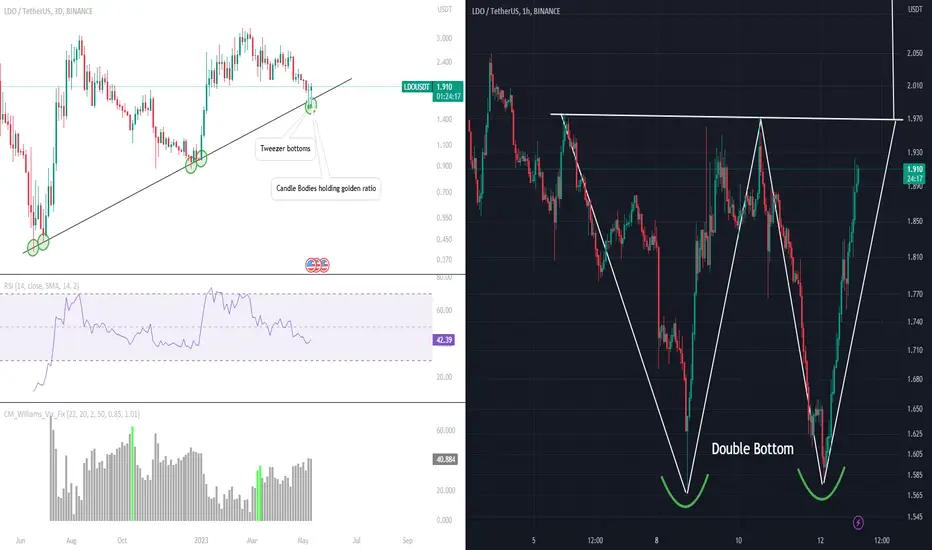
The chart on the left shows the 3 day (longer term timeframe) and the chart one the right shows the 1 Hour (Shorter Timeframe).
On our 3D we can see we have respected our trendline (green circles). We also had tweezer bottoms on the 3D and so far our candle bodies are still respecting the 0.618.
On the 1H it looks like we are forming a W pattern. A breakout of the neckline could send us around $2.40. We also created a double bottom in price.
Disclaimer
The information and publications are not meant to be, and do not constitute, financial, investment, trading, or other types of advice or recommendations supplied or endorsed by TradingView. Read more in the Terms of Use.
Disclaimer
The information and publications are not meant to be, and do not constitute, financial, investment, trading, or other types of advice or recommendations supplied or endorsed by TradingView. Read more in the Terms of Use.