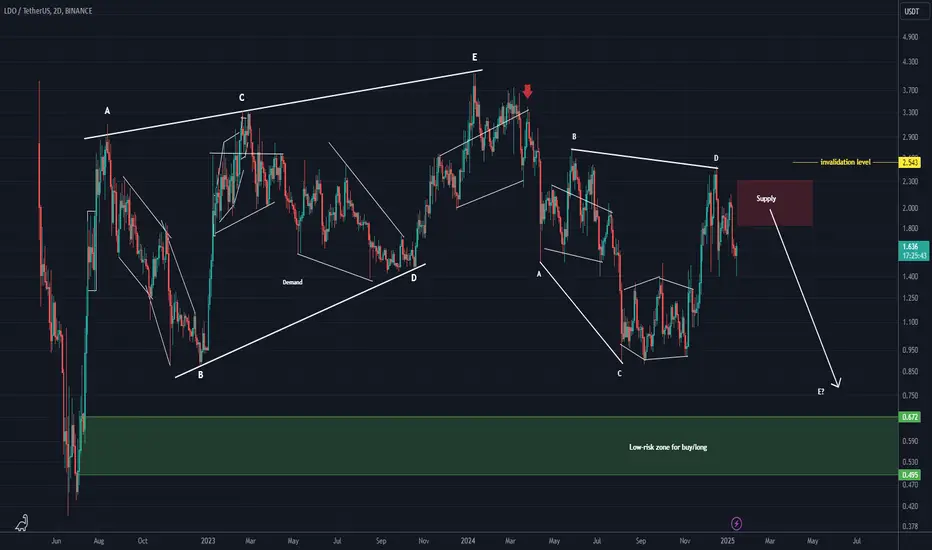
Before anything, pay attention to the timeframe; it’s a 2-day timeframe and requires patience.
From the point where we placed the red arrow on the chart, it seems that the bullish LDO pattern, which was a triangle, has completed. LDO has now entered a bearish pattern of the same degree as the previous bullish pattern.
LDO is expected to remain bearish in the medium term and not break above the red box marked on the chart.
The low-risk area for buy positions in spot has been identified for buyers.
The closure of a daily candle above the invalidation level will invalidate this analysis
For risk management, please don't forget stop loss and capital management
Comment if you have any questions
Thank You
Trade active
After hitting the red zone, it dropped more than 36%. The movement was on a higher time frame, and it took quite some time.Trade closed: target reached
After hitting the Supply zone without touching the invalidation level, it dropped more than 63% and reached the highlighted green zone, completing wave e.We will publish updated analyses on LDO soon.
🔆To succeed in trading, just enter our Telegram channel:
Free membership: t.me/Behdark_EN
🔷Our Telegram channel has daily spot and futures signals 👉 t.me/Behdark_EN
💎 Exclusive signals are only shared on our Telegram channel
Free membership: t.me/Behdark_EN
🔷Our Telegram channel has daily spot and futures signals 👉 t.me/Behdark_EN
💎 Exclusive signals are only shared on our Telegram channel
Disclaimer
The information and publications are not meant to be, and do not constitute, financial, investment, trading, or other types of advice or recommendations supplied or endorsed by TradingView. Read more in the Terms of Use.