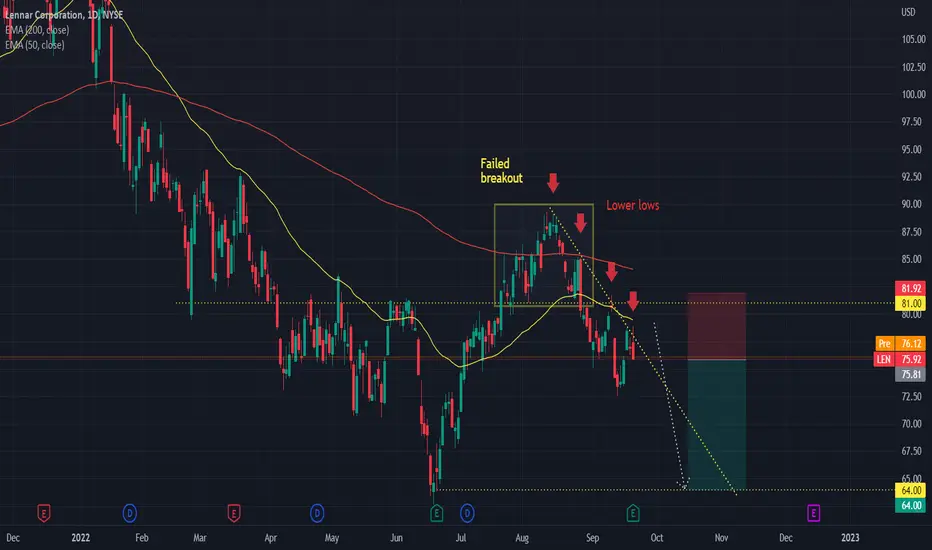
LEN
Daily chart analysis
LEN is currently in a downtrend under the 200 ema
After reaching low of 64.00, pulled back and broke above resistance level at 81.00
The breakout is deemed a failed breakout after price falls back below 81.00
Price has the followed by making a series of lower lows creating a downtrend line
Price is currently at resistance from down trendline, an area of value.
This is my cue to enter trade short.
Entry: 75.81
Stop loss: 81.92
Target: 64.00, +15.58%, 1.93 RR ratio
Disclaimer
The information and publications are not meant to be, and do not constitute, financial, investment, trading, or other types of advice or recommendations supplied or endorsed by TradingView. Read more in the Terms of Use.
Disclaimer
The information and publications are not meant to be, and do not constitute, financial, investment, trading, or other types of advice or recommendations supplied or endorsed by TradingView. Read more in the Terms of Use.